
Page 93 - Advances in Biomechanics and Tissue Regeneration
P. 93
88 5. IMPACT OF THE FLUID-STRUCTURE INTERACTION MODELING ON THE HUMAN VESSEL HEMODYNAMICS
2 0.4
min WSS - CFD min WSS - CFD
min WSS - FSI min WSS - FSI
1.5 0.3
WSS [Pa] 1 WSS [Pa] 0.2
0.5 0.1
0 0
0 0.2 0.4 0.6 0.8 1 0 0.2 0.4 0.6 0.8
Time [s] Time [s]
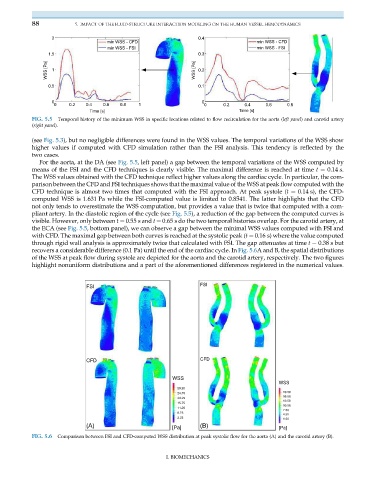
FIG. 5.5 Temporal history of the minimum WSS in specific locations related to flow recirculation for the aorta (left panel) and carotid artery
(right panel).
(see Fig. 5.3), but no negligible differences were found in the WSS values. The temporal variations of the WSS show
higher values if computed with CFD simulation rather than the FSI analysis. This tendency is reflected by the
two cases.
For the aorta, at the DA (see Fig. 5.5, left panel) a gap between the temporal variations of the WSS computed by
means of the FSI and the CFD techniques is clearly visible. The maximal difference is reached at time t ¼ 0.14 s.
The WSS values obtained with the CFD technique reflect higher values along the cardiac cycle. In particular, the com-
parison between the CFD and FSI techniques shows that the maximal value of the WSS at peak flow computed with the
CFD technique is almost two times that computed with the FSI approach. At peak systole (t ¼ 0.14 s), the CFD-
computed WSS is 1.631 Pa while the FSI-computed value is limited to 0.8541. The latter highlights that the CFD
not only tends to overestimate the WSS computation, but provides a value that is twice that computed with a com-
pliant artery. In the diastolic region of the cycle (see Fig. 5.5), a reduction of the gap between the computed curves is
visible. However, only between t ¼ 0.55 s and t ¼ 0.65 s do the two temporal histories overlap. For the carotid artery, at
the ECA (see Fig. 5.5, bottom panel), we can observe a gap between the minimal WSS values computed with FSI and
with CFD. The maximal gap between both curves is reached at the systolic peak (t ¼ 0.16 s) where the value computed
through rigid wall analysis is approximately twice that calculated with FSI. The gap attenuates at time t ¼ 0.38 s but
recovers a considerable difference (0.1 Pa) until the end of the cardiac cycle. In Fig. 5.6A and B, the spatial distributions
of the WSS at peak flow during systole are depicted for the aorta and the carotid artery, respectively. The two figures
highlight nonuniform distributions and a part of the aforementioned differences registered in the numerical values.
FSI FSI
CFD CFD
WSS
WSS
29.25
24.75 19.50
16.50
20.25
13.50
15.75
10.50
11.25
7.50
6.75
4.50
2.25 1.50
(A) [Pa] (B) [Pa]
FIG. 5.6 Comparison between FSI and CFD-computed WSS distribution at peak systolic flow for the aorta (A) and the carotid artery (B).
I. BIOMECHANICS