
Page 95 - Advances in Biomechanics and Tissue Regeneration
P. 95
90 5. IMPACT OF THE FLUID-STRUCTURE INTERACTION MODELING ON THE HUMAN VESSEL HEMODYNAMICS
CFD technique, and the differences in the spatial distribution are quite evident. Between the two considered cases,
the differences are more pronounced in the aorta while the carotid artery is similar for both techniques. The regions
with high TAWSS along the artery are, in fact, quite similar for the carotid artery in both cases, although the peak of
low TAWSS is slightly different. On the contrary, the aorta shows considerable differences in the spatial distribution
of the high WSS in the two considered cases. These distributions once again highlight that the CFD technique tends
to overestimate the WSS and its related variables with respect to the FSI technique, even in the averaged values.
From the presented results, we can conclude that the arterial compliance strongly affects the WSS evaluation. The
compliance of the arterial walls dilates the vessel, and the WSS is consequently altered, as observed in other works for
both aorta and carotid hemodynamics [13, 16]. Generally speaking, the CFD is used more frequently with respect to the
FSI technique due to its reduced computational costs. In this work, we suggest that the arterial hemodynamics should
include compliant vessels. For assessing the risk of atherogenesis, in the computation of the WSS and its related indices,
the compliance can be neglected only as a first approximation because important differences in the spatial amplitude
and intensity can be found.
5.3.4 Arterial Compliance
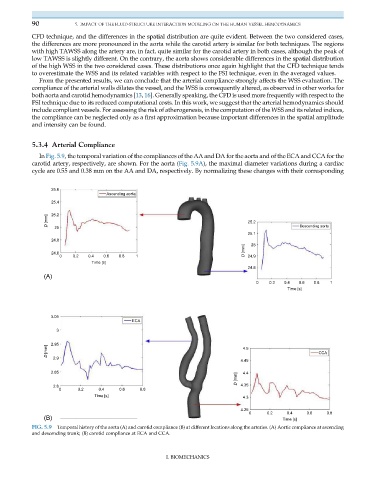
In Fig. 5.9, the temporal variation of the compliances of the AA and DA for the aorta and of the ECA and CCA for the
carotid artery, respectively, are shown. For the aorta (Fig. 5.9A), the maximal diameter variations during a cardiac
cycle are 0.55 and 0.38 mm on the AA and DA, respectively. By normalizing these changes with their corresponding
25.6
Ascending aorta
25.4
D [mm] 25.2 25.2
25 Descending aorta
25.1
24.8 25
D [mm]
24.6
0 0.2 0.4 0.6 0.8 1 24.9
Time [s]
24.8
(A)
0 0.2 0.4 0.6 0.8 1
Time [s]
3.05
ECA
3
2.95
D [mm] 4.5 CCA
2.9
4.45
2.85 4.4
D [mm]
2.8 4.35
0 0.2 0.4 0.6 0.8
Time [s] 4.3
4.25
0 0.2 0.4 0.6 0.8
(B) Time [s]
FIG. 5.9 Temporal history of the aorta (A) and carotid compliance (B) at different locations along the arteries. (A) Aortic compliance at ascending
and descending trunk; (B) carotid compliance at ECA and CCA.
I. BIOMECHANICS