
Page 94 - Advances in Biomechanics and Tissue Regeneration
P. 94
5.3 RESULTS 89
In both cases, it is clearly visible that the amplitude of the low WSS regions is reduced when computed using the CFD
technique. The reduction is visible in the descending trunk of the aorta (see Fig. 5.6A), both in the frontal and dorsal
view as well as in the respective views of the carotid artery (see Fig. 5.6B). In the latter, the low WSS regions registered
at the ECA, ICA, and CCA are strongly spatially less extended than those computed, including the compliance.
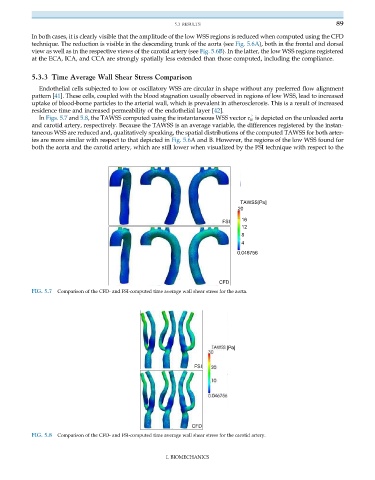
5.3.3 Time Average Wall Shear Stress Comparison
Endothelial cells subjected to low or oscillatory WSS are circular in shape without any preferred flow alignment
pattern [41]. These cells, coupled with the blood stagnation usually observed in regions of low WSS, lead to increased
uptake of blood-borne particles to the arterial wall, which is prevalent in atherosclerosis. This is a result of increased
residence time and increased permeability of the endothelial layer [42].
In Figs. 5.7 and 5.8, the TAWSS computed using the instantaneous WSS vector τ w is depicted on the unloaded aorta
!
and carotid artery, respectively. Because the TAWSS is an average variable, the differences registered by the instan-
taneous WSS are reduced and, qualitatively speaking, the spatial distributions of the computed TAWSS for both arter-
ies are more similar with respect to that depicted in Fig. 5.6A and B. However, the regions of the low WSS found for
both the aorta and the carotid artery, which are still lower when visualized by the FSI technique with respect to the
TAWSS[Pa]
20
16
FSI
12
8
4
0.046756
CFD
FIG. 5.7 Comparison of the CFD- and FSI-computed time average wall shear stress for the aorta.
[Pa]
FSI
CFD
FIG. 5.8 Comparison of the CFD- and FSI-computed time average wall shear stress for the carotid artery.
I. BIOMECHANICS