
Page 400 -
P. 400
380 CHAPTER 9 PROJECT SCHEDULING: PERT/CPM
Figure 9.7 The Management Scientist Activity Schedule for the Souk Al Bustan
Shopping Centre Project
*** ACTIVITY SCHEDULE ***
EARLIEST LATEST EARLIEST LATEST CRITICAL
ACTIVITY START START FINISH FINISH SLACK ACTIVITY
---------------------------------------------------------------
A 0 0 5 5 0 YES
EXCEL file
B 0 6 6 12 6
SAB C 5 8 9 12 3
D 5 7 8 10 2
E 5 5 6 6 0 YES
F 6 6 10 10 0 YES
G 10 10 24 24 0 YES
H 9 12 21 24 3
I 24 24 26 26 0 YES
---------------------------------------------------------------
CRITICAL PATH: A-E-F-G-I
PROJECT COMPLETION TIME = 26
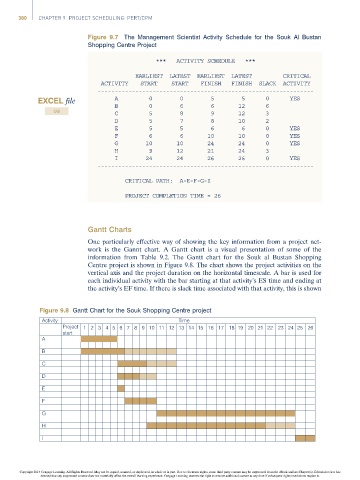
Gantt Charts
One particularly effective way of showing the key information from a project net-
work is the Gannt chart. A Gantt chart is a visual presentation of some of the
information from Table 9.2. The Gantt chart for the Souk al Bustan Shopping
Centre project is shown in Figure 9.8. The chart shows the project activities on the
vertical axis and the project duration on the horizontal timescale. A bar is used for
each individual activity with the bar starting at that activity’s ES time and ending at
the activity’s EF time. If there is slack time associated with that activity, this is shown
Figure 9.8 Gantt Chart for the Souk Shopping Centre project
Activity Time
Project 1 2 3 4 56 7 8 910 11121314 15 16 17 18 19 20 21 22 23 24 25 26
start
A
B
C
D
E
F
G
H
I
Copyright 2014 Cengage Learning. All Rights Reserved. May not be copied, scanned, or duplicated, in whole or in part. Due to electronic rights, some third party content may be suppressed from the eBook and/or eChapter(s). Editorial review has
deemed that any suppressed content does not materially affect the overall learning experience. Cengage Learning reserves the right to remove additional content at any time if subsequent rights restrictions require it.