Page 404 -
P. 404

384   CHAPTER 9 PROJECT SCHEDULING: PERT/CPM


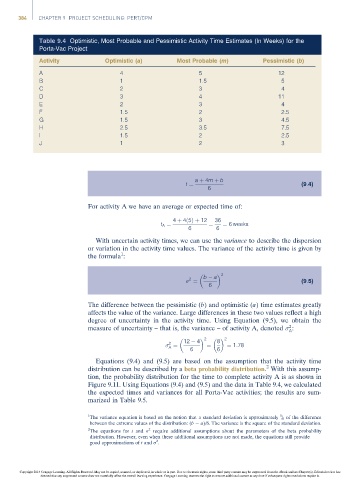
                      Table 9.4 Optimistic, Most Probable and Pessimistic Activity Time Estimates (In Weeks) for the
                      Porta-Vac Project
                      Activity            Optimistic (a)        Most Probable (m)         Pessimistic (b)

                      A                       4                        5                       12
                      B                       1                        1.5                      5
                      C                       2                        3                        4
                      D                       3                        4                       11
                      E                       2                        3                        4
                      F                       1.5                      2                        2.5
                      G                       1.5                      3                        4.5
                      H                       2.5                      3.5                      7.5
                      I                       1.5                      2                        2.5
                      J                       1                        2                        3


                                                                     a þ 4m þ b
                                                                   t ¼                                (9:4)
                                                                         6
                                     For activity A we have an average or expected time of:

                                                               4 þ 4ð5Þþ 12  36
                                                           t A ¼          ¼   ¼ 6 weeks
                                                                   6        6
                                       With uncertain activity times, we can use the variance to describe the dispersion
                                     or variation in the activity time values. The variance of the activity time is given by
                                               1
                                     the formula :
                                                                              2
                                                                        b   a
                                                                    2
                                                                     ¼                                (9:5)
                                                                          6
                                     The difference between the pessimistic (b) and optimistic (a) time estimates greatly
                                     affects the value of the variance. Large differences in these two values reflect a high
                                     degree of uncertainty in the activity time. Using Equation (9.5), we obtain the
                                                                                                  2
                                     measure of uncertainty – that is, the variance – of activity A, denoted   :
                                                                                                  A
                                                                   12   4   2     2
                                                                            8
                                                             2
                                                              ¼          ¼     ¼ 1:78
                                                             A
                                                                    6       6
                                       Equations (9.4) and (9.5) are based on the assumption that the activity time
                                                                                           2
                                     distribution can be described by a beta probability distribution. With this assump-
                                     tion, the probability distribution for the time to complete activity A is as shown in
                                     Figure 9.11. Using Equations (9.4) and (9.5) and the data in Table 9.4, we calculated
                                     the expected times and variances for all Porta-Vac activities; the results are sum-
                                     marized in Table 9.5.
                                                                                                1
                                     1 The variance equation is based on the notion that a standard deviation is approximately / 6 of the difference
                                     between the extreme values of the distribution: (b   a)/6. The variance is the square of the standard deviation.
                                     2                 2
                                     The equations for t and s require additional assumptions about the parameters of the beta probability
                                     distribution. However, even when these additional assumptions are not made, the equations still provide
                                     good approximations of t and s . 2


                Copyright 2014 Cengage Learning. All Rights Reserved. May not be copied, scanned, or duplicated, in whole or in part. Due to electronic rights, some third party content may be suppressed from the eBook and/or eChapter(s). Editorial review has
                      deemed that any suppressed content does not materially affect the overall learning experience. Cengage Learning reserves the right to remove additional content at any time if subsequent rights restrictions require it.
   399   400   401   402   403   404   405   406   407   408   409