
Page 118 - Applied Process Design For Chemical And Petrochemical Plants Volume III
P. 118
66131_Ludwig_CH10C 5/30/2001 4:21 PM Page 85
Heat Transfer 85
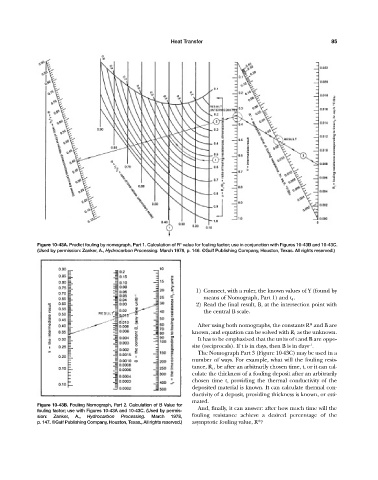
Figure 10-43A. Predict fouling by nomograph, Part 1. Calculation of R* value for fouling factor; use in conjunction with Figures 10-43B and 10-43C.
(Used by permission: Zanker, A., Hydrocarbon Processing. March 1978, p. 146. ©Gulf Publishing Company, Houston, Texas. All rights reserved.)
1) Connect, with a ruler, the known values of Y (found by
means of Nomograph, Part 1) and t 1 .
2) Read the final result, B, at the intersection point with
the central B scale.
After using both nomographs, the constants R* and B are
known, and equation can be solved with R 1 as the unknown.
It has to be emphasized that the units of t and B are oppo-
–1
site (reciprocals). If t is in days, then B is in days .
The Nomograph Part 3 (Figure 10-43C) may be used in a
number of ways. For example, what will the fouling resis-
tance, R t , be after an arbitrarily chosen time, t, or it can cal-
culate the thickness of a fouling deposit after an arbitrarily
chosen time t, providing the thermal conductivity of the
deposited material is known. It can calculate thermal con-
ductivity of a deposit, providing thickness is known, or esti-
mated.
Figure 10-43B. Fouling Nomograph, Part 2. Calculation of B Value for
fouling factor; use with Figures 10-43A and 10-43C. (Used by permis- And, finally, it can answer: after how much time will the
sion: Zanker, A., Hydrocarbon Processing. March 1978, fouling resistance achieve a desired percentage of the
p. 147. ©Gulf Publishing Company, Houston, Texas., All rights reserved.) asymptotic fouling value, R*?