
Page 163 - Applied Numerical Methods Using MATLAB
P. 163
152 INTERPOLATION AND CURVE FITTING
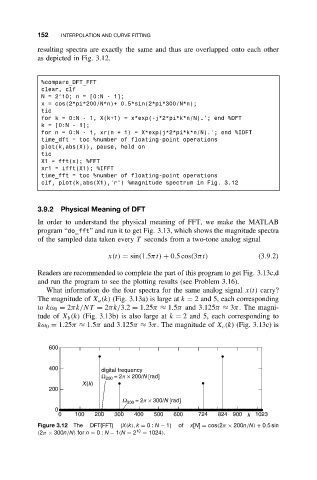
resulting spectra are exactly the same and thus are overlapped onto each other
as depicted in Fig. 3.12.
%compare_DFT_FFT
clear, clf
N = 2^10; n = [0:N - 1];
x = cos(2*pi*200/N*n)+ 0.5*sin(2*pi*300/N*n);
tic
for k = 0:N - 1, X(k+1) = x*exp(-j*2*pi*k*n/N).’; end %DFT
k = [0:N - 1];
for n = 0:N - 1, xr(n + 1) = X*exp(j*2*pi*k*n/N).’; end %IDFT
time_dft = toc %number of floating-point operations
plot(k,abs(X)), pause, hold on
tic
X1 = fft(x); %FFT
xr1 = ifft(X1); %IFFT
time_fft = toc %number of floating-point operations
clf, plot(k,abs(X1),’r’) %magnitude spectrum in Fig. 3.12
3.9.2 Physical Meaning of DFT
In order to understand the physical meaning of FFT, we make the MATLAB
program “do_fft” and run it to get Fig. 3.13, which shows the magnitude spectra
of the sampled data taken every T seconds from a two-tone analog signal
x(t) = sin(1.5πt) + 0.5cos(3πt) (3.9.2)
Readers are recommended to complete the part of this program to get Fig. 3.13c,d
and run the program to see the plotting results (see Problem 3.16).
What information do the four spectra for the same analog signal x(t) carry?
The magnitude of X a (k) (Fig. 3.13a) is large at k = 2 and 5, each corresponding
to kω 0 = 2πk/NT = 2πk/3.2 = 1.25π ≈ 1.5π and 3.125π ≈ 3π. The magni-
tude of X b (k) (Fig. 3.13b) is also large at k = 2 and 5, each corresponding to
kω 0 = 1.25π ≈ 1.5π and 3.125π ≈ 3π. The magnitude of X c (k) (Fig. 3.13c) is
600
400 digital frequency
Ω 200 = 2p × 200/N [rad]
X(k)
200
Ω 300 = 2p × 300/N [rad]
0
0 100 200 300 400 500 600 724 824 900 k 1023
Figure 3.12 The DFT(FFT) {X(k), k = 0: N − 1} of x[N] = cos(2π × 200n/N) + 0.5sin
(2π × 300n/N) for n = 0: N − 1(N = 2 10 = 1024).