
Page 246 - Applied Statistics Using SPSS, STATISTICA, MATLAB and R
P. 246
6.2 Linear Discriminants 227
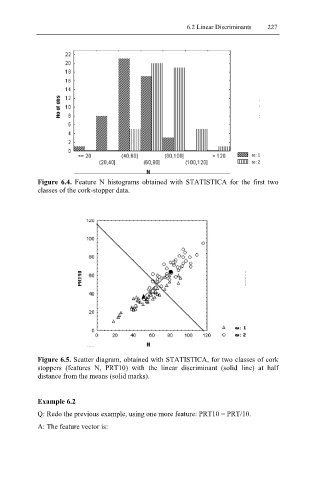
Figure 6.4. Feature N histograms obtained with STATISTICA for the first two
classes of the cork-stopper data.
Figure 6.5. Scatter diagram, obtained with STATISTICA, for two classes of cork
stoppers (features N, PRT10) with the linear discriminant (solid line) at half
distance from the means (solid marks).
Example 6.2
Q: Redo the previous example, using one more feature: PRT10 = PRT/10.
A: The feature vector is: