
Page 252 - Applied Statistics Using SPSS, STATISTICA, MATLAB and R
P. 252
6.2 Linear Discriminants 233
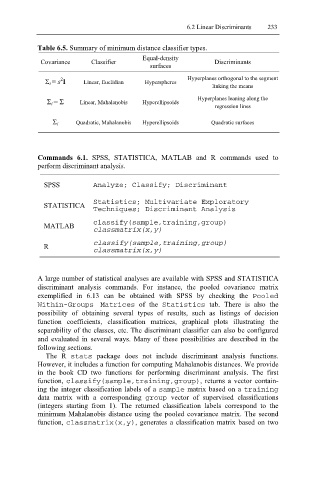
Table 6.5. Summary of minimum distance classifier types.
Equal-density
Covariance Classifier Discriminants
surfaces
2
Σ i = s I Linear, Euclidian Hyperspheres Hyperplanes orthogonal to the segment
linking the means
Hyperplanes leaning along the
Σ i = Σ Linear, Mahalanobis Hyperellipsoids
regression lines
Σ i Quadratic, Mahalanobis Hyperellipsoids Quadratic surfaces
Commands 6.1. SPSS, STATISTICA, MATLAB and R commands used to
perform discriminant analysis.
SPSS Analyze; Classify; Discriminant
STATISTICA Statistics; Multivariate Exploratory
Techniques; Discriminant Analysis
MATLAB classify(sample,training,group)
classmatrix(x,y)
R classify(sample,training,group)
classmatrix(x,y)
A large number of statistical analyses are available with SPSS and STATISTICA
discriminant analysis commands. For instance, the pooled covariance matrix
exemplified in 6.13 can be obtained with SPSS by checking the Pooled
Within-Groups Matrices of the Statistics tab. There is also the
possibility of obtaining several types of results, such as listings of decision
function coefficients, classification matrices, graphical plots illustrating the
separability of the classes, etc. The discriminant classifier can also be configured
and evaluated in several ways. Many of these possibilities are described in the
following sections.
The R stats package does not include discriminant analysis functions.
However, it includes a function for computing Mahalanobis distances. We provide
in the book CD two functions for performing discriminant analysis. The first
function, classify(sample,training,group) , returns a vector contain-
ing the integer classification labels of a sample matrix based on a training
data matrix with a corresponding group vector of supervised classifications
(integers starting from 1). The returned classification labels correspond to the
minimum Mahalanobis distance using the pooled covariance matrix. The second
function, classmatrix(x,y) , generates a classification matrix based on two