
Page 256 - Applied Statistics Using SPSS, STATISTICA, MATLAB and R
P. 256
6.3 Bayesian Classification 237
Figure 6.9. Influence of the prevalence threshold on the classification errors,
represented by the shaded areas (dark grey represents the errors for class ω 1). (a)
Equal prevalences; (b) Unequal prevalences.
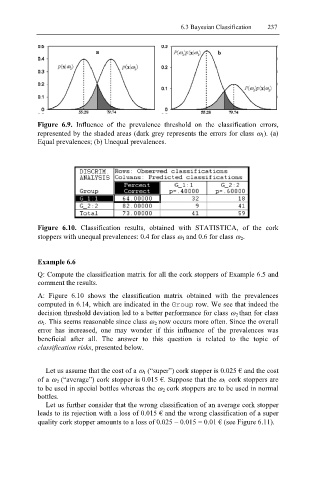
Figure 6.10. Classification results, obtained with STATISTICA, of the cork
stoppers with unequal prevalences: 0.4 for class ω 1 and 0.6 for class ω 2.
Example 6.6
Q: Compute the classification matrix for all the cork stoppers of Example 6.5 and
comment the results.
A: Figure 6.10 shows the classification matrix obtained with the prevalences
computed in 6.14, which are indicated in the Group row. We see that indeed the
decision threshold deviation led to a better performance for class ω 2 than for class
ω 1. This seems reasonable since class ω 2 now occurs more often. Since the overall
error has increased, one may wonder if this influence of the prevalences was
beneficial after all. The answer to this question is related to the topic of
classification risks, presented below.
Let us assume that the cost of a ω 1 (“super”) cork stopper is 0.025 € and the cost
of a ω 2 (“average”) cork stopper is 0.015 €. Suppose that the ω 1 cork stoppers are
to be used in special bottles whereas the ω 2 cork stoppers are to be used in normal
bottles.
Let us further consider that the wrong classification of an average cork stopper
leads to its rejection with a loss of 0.015 € and the wrong classification of a super
quality cork stopper amounts to a loss of 0.025 − 0.015 = 0.01 € (see Figure 6.11).