
Page 259 - Applied Statistics Using SPSS, STATISTICA, MATLAB and R
P. 259
240 6 Statistical Classification
ω 2 cork stoppers wrongly classified as ω 1. This is shown in the classification matrix
of Table 6.6.
We can now compute the average risk for this two-class situation, as follows:
=
R λ 12 Pe + λ 21 Pe ,
21
12
where Pe ij is the error probability of deciding class ω i when the true class is ω j.
Using the training set estimates of these errors, Pe 12 = 0.1 and Pe 21 = 0.46 (see
Table 6.6), the estimated average risk per cork stopper is computed as
R = 0.015×Pe 12 + 0.01×Pe 21 = 0.015×0.01 + 0.01×0.46 = 0.0061 €. If we had not
used the adjusted prevalences, we would have obtained the higher risk estimate of
0.0063 € (use the Pe ij estimates from Figure 6.10).
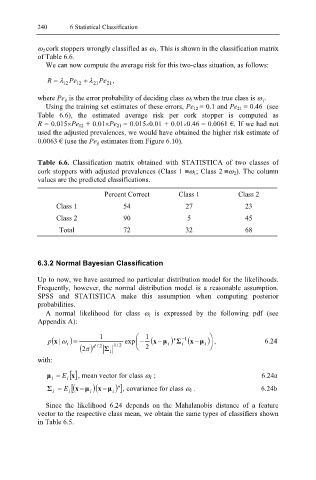
Table 6.6. Classification matrix obtained with STATISTICA of two classes of
cork stoppers with adjusted prevalences (Class 1 ≡ω 1; Class 2 ≡ω 2). The column
values are the predicted classifications.
Percent Correct Class 1 Class 2
Class 1 54 27 23
Class 2 90 5 45
Total 72 32 68
6.3.2 Normal Bayesian Classification
Up to now, we have assumed no particular distribution model for the likelihoods.
Frequently, however, the normal distribution model is a reasonable assumption.
SPSS and STATISTICA make this assumption when computing posterior
probabilities.
A normal likelihood for class ω i is expressed by the following pdf (see
Appendix A):
( ) p x |ω = 1 exp 1 ( − x ) −µ ’ −1 ( Σ x ) −µ , 6.24
i
( )2π d 2/ Σ i 2 / 1 2 i i i
with:
µ = E i [] x , mean vector for class ω I ; 6.24a
i
) ] x −
Σ = E i ( [ µ i )(x − µ ’ , covariance for class ω i . 6.24b
i
i
Since the likelihood 6.24 depends on the Mahalanobis distance of a feature
vector to the respective class mean, we obtain the same types of classifiers shown
in Table 6.5.