
Page 262 - Applied Statistics Using SPSS, STATISTICA, MATLAB and R
P. 262
6.3 Bayesian Classification 243
0.5
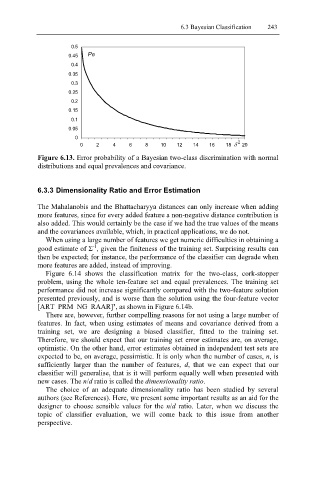
0.45 Pe
0.4
0.35
0.3
0.25
0.2
0.15
0.1
0.05
0
0 2 4 6 8 10 12 14 16 18 δ 2 20
Figure 6.13. Error probability of a Bayesian two-class discrimination with normal
distributions and equal prevalences and covariance.
6.3.3 Dimensionality Ratio and Error Estimation
The Mahalanobis and the Bhattacharyya distances can only increase when adding
more features, since for every added feature a non-negative distance contribution is
also added. This would certainly be the case if we had the true values of the means
and the covariances available, which, in practical applications, we do not.
When using a large number of features we get numeric difficulties in obtaining a
-1
good estimate of Σ , given the finiteness of the training set. Surprising results can
then be expected; for instance, the performance of the classifier can degrade when
more features are added, instead of improving.
Figure 6.14 shows the classification matrix for the two-class, cork-stopper
problem, using the whole ten-feature set and equal prevalences. The training set
performance did not increase significantly compared with the two-feature solution
presented previously, and is worse than the solution using the four-feature vector
[ART PRM NG RAAR]’, as shown in Figure 6.14b.
There are, however, further compelling reasons for not using a large number of
features. In fact, when using estimates of means and covariance derived from a
training set, we are designing a biased classifier, fitted to the training set.
Therefore, we should expect that our training set error estimates are, on average,
optimistic. On the other hand, error estimates obtained in independent test sets are
expected to be, on average, pessimistic. It is only when the number of cases, n, is
sufficiently larger than the number of features, d, that we can expect that our
classifier will generalise, that is it will perform equally well when presented with
new cases. The n/d ratio is called the dimensionality ratio.
The choice of an adequate dimensionality ratio has been studied by several
authors (see References). Here, we present some important results as an aid for the
designer to choose sensible values for the n/d ratio. Later, when we discuss the
topic of classifier evaluation, we will come back to this issue from another
perspective.