
Page 266 - Applied Statistics Using SPSS, STATISTICA, MATLAB and R
P. 266
6.4 The ROC Curve 247
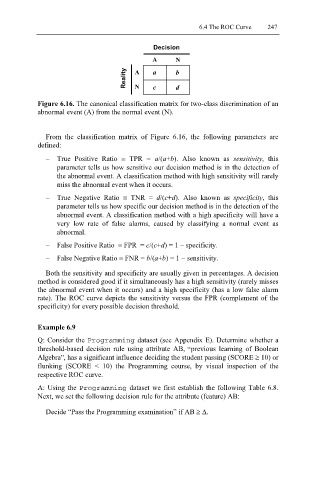
Decision
A N
Reality A a b
N
c
d
Figure 6.16. The canonical classification matrix for two-class discrimination of an
abnormal event (A) from the normal event (N).
From the classification matrix of Figure 6.16, the following parameters are
defined:
− True Positive Ratio ≡ TPR = a/(a+b). Also known as sensitivity, this
parameter tells us how sensitive our decision method is in the detection of
the abnormal event. A classification method with high sensitivity will rarely
miss the abnormal event when it occurs.
− True Negative Ratio ≡ TNR = d/(c+d). Also known as specificity, this
parameter tells us how specific our decision method is in the detection of the
abnormal event. A classification method with a high specificity will have a
very low rate of false alarms, caused by classifying a normal event as
abnormal.
− False Positive Ratio ≡ FPR = c/(c+d) = 1 − specificity.
− False Negative Ratio ≡ FNR = b/(a+b) = 1 − sensitivity.
Both the sensitivity and specificity are usually given in percentages. A decision
method is considered good if it simultaneously has a high sensitivity (rarely misses
the abnormal event when it occurs) and a high specificity (has a low false alarm
rate). The ROC curve depicts the sensitivity versus the FPR (complement of the
specificity) for every possible decision threshold.
Example 6.9
Q: Consider the Programming dataset (see Appendix E). Determine whether a
threshold-based decision rule using attribute AB, previous learning of Boolean
“
Algebra , has a significant influence deciding the student passing (SCORE ≥ 10) or
”
flunking (SCORE < 10) the Programming course, by visual inspection of the
respective ROC curve.
A: Using the Programming dataset we first establish the following Table 6.8.
Next, we set the following decision rule for the attribute (feature) AB:
≥
Decide “Pass the Programming examination” if AB Δ.