
Page 372 - Automotive Engineering Powertrain Chassis System and Vehicle Body
P. 372
Braking systems C HAPTER 12.1
z
h ¼ 1.2 Optimum
m
Front axle
lmF r
1.0 Rear axle
Pðlx r þ mhÞ
¼ (12.1.58)
m
0.8 Front
F r
¼ g axle
mh lock
P x r þ
l Deceleration 0.6 a
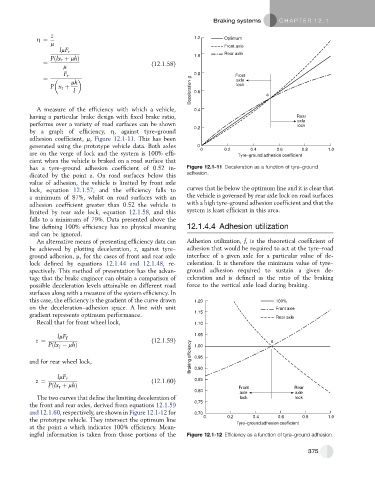
A measure of the efficiency with which a vehicle, 0.4
having a particular brake design with fixed brake ratio, Rear
axle
performs over a variety of road surfaces can be shown lock
0.2
by a graph of efficiency, h, against tyre–ground
adhesion coefficient, m, Figure 12.1-11. This has been
generated using the prototype vehicle data. Both axles 0
0 0.2 0.4 0.6 0.8 1.0
are on the verge of lock and the system is 100% effi- Tyre–ground adhesion coefficient
cient when the vehicle is braked on a road surface that
has a tyre–ground adhesion coefficient of 0.52 in- Figure 12.1-11 Deceleration as a function of tyre–ground
dicated by the point a. On road surfaces below this adhesion.
value of adhesion, the vehicle is limited by front axle
lock, equation 12.1.57, and the efficiency falls to curves that lie below the optimum line and it is clear that
a minimum of 87%, whilst on road surfaces with an the vehicle is governed by rear axle lock on road surfaces
adhesion coefficient greater than 0.52 the vehicle is with a high tyre–ground adhesion coefficient and that the
limited by rear axle lock, equation 12.1.58, and this system is least efficient in this area.
falls to a minimum of 79%. Data presented above the
line defining 100% efficiency has no physical meaning 12.1.4.4 Adhesion utilization
and can be ignored.
An alternative means of presenting efficiency data can Adhesion utilization, f, is the theoretical coefficient of
be achieved by plotting deceleration, z, against tyre– adhesion that would be required to act at the tyre–road
ground adhesion, m, for the cases of front and rear axle interface of a given axle for a particular value of de-
lock defined by equations 12.1.44 and 12.1.48, re- celeration. It is therefore the minimum value of tyre–
spectively. This method of presentation has the advan- ground adhesion required to sustain a given de-
tage that the brake engineer can obtain a comparison of celeration and is defined as the ratio of the braking
possible deceleration levels attainable on different road force to the vertical axle load during braking.
surfaces along with a measure of the system efficiency. In
this case, the efficiency is the gradient of the curve drawn 1.20 100%
on the deceleration–adhesion space. A line with unit Front axle
1.15
gradient represents optimum performance.
Rear axle
Recall that for front wheel lock, 1.10
lmF f 1.05
z ¼ (12.1.59) a
Braking efficiency 0.95
Pðlx mhÞ 1.00
f
and for rear wheel lock, 0.90
lmF r 0.85
z ¼ (12.1.60)
Pðlx r þ mhÞ Front Rear
0.80
axle axle
The two curves that define the limiting deceleration of lock lock
0.75
the front and rear axles, derived from equations 12.1.59
and 12.1.60, respectively, are shown in Figure 12.1-12 for 0.70
0 0.2 0.4 0.6 0.8 1.0
the prototype vehicle. They intersect the optimum line Tyre–ground adhesion coefficient
at the point a which indicates 100% efficiency. Mean-
ingful information is taken from those portions of the Figure 12.1-12 Efficiency as a function of tyre–ground adhesion.
375