
Page 374 - Automotive Engineering Powertrain Chassis System and Vehicle Body
P. 374
Braking systems C HAPTER 12.1
characteristics for the vehicle. The point labelled a,at the brake force coefficient increases in a roughly linear
which the curves cross, intersect the optimum line of ad- fashion to its maximum value, m p , at 20% longitudinal
hesion utilization indicating that at this value of de- slip. Further increase, due to increase in applied brake
celeration both axles are on the verge of lock. The axle torque, causes the wheel to decelerate rapidly to a con-
having the highest adhesion utilization coefficient for dition of full lock and the brake force coefficient takes
a given value of deceleration is that which limits the a value of m s at 100% longitudinal slip. The ratio of m p /m s
braking performance of the vehicle and, in this case, depends upon the nature of the road surface in question
braking is limited by front axle lock up to a deceleration of and it takes its highest value under wet or icy conditions.
0.52g. Thereafter, braking is limited by rear axle lock. It is This leads to a possible scenario in which a vehicle is
also possible to find from this diagram the maximum de- capable of generating its maximum braking potential
celeration for a given coefficient of adhesion utilization. when one axle is locked and the second is on the verge of
Comparison of the adhesion utilization diagram lock. This contrasts with the generally accepted idea that
derived for the prototype vehicle with the legislative maximum deceleration occurs when the first axle is
requirements outlined in Section 12.1.2 shows that the about to lock and is dependent upon the vehicle weight
vehicle brake system does not meet the minimum stan- distribution and the fixed braking ratio.
dard, as the front axle adhesion curve does not lie above If the front axle is locked and the rear axle is about to
that of the rear axle for all values of deceleration between lock then the total brake force is given by:
0.15g and 0.8g. This can be remedied by changing the
fixed brake ratio in favour of the rear axle and this causes Pzh Pzh
the point a to move up the optimum adhesion line. The Pz ¼ m s F þ l þ m p F r l (12.1.65)
f
limiting deceleration is set at 0.8g which leads to a new
fixed brake ratio of x f ¼ 0:803 . This in turn results in the
x r 0:197 Similarly, if the rear axle is locked and the front axle is
modified adhesion diagram shown in Figure 12.1-13b,
on the verge of lock, then the total brake force is:
which this satisfies the legislative requirements. The
modified vehicle is governed by front axle lock up to Pzh Pzh
a deceleration level of 0.8g, achieved at the expense of Pz ¼ m p F þ l þ m s F r l (12.1.66)
f
the overall brake system efficiency (Figure 12.1-13c).
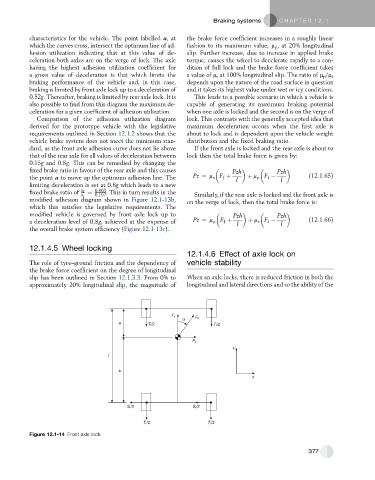
12.1.4.5 Wheel locking
12.1.4.6 Effect of axle lock on
The role of tyre–ground friction and the dependency of vehicle stability
the brake force coefficient on the degree of longitudinal
slip has been outlined in Section 12.1.3.3. From 0% to When an axle locks, there is reduced friction in both the
approximately 20% longitudinal slip, the magnitude of longitudinal and lateral directions and so the ability of the
F x
α F R
a T f /2 T f /2
F y
x
l
b
y
S r /2 S r /2
T r /2 T r /2
Figure 12.1-14 Front axle lock.
377