
Page 373 - Automotive Engineering Powertrain Chassis System and Vehicle Body
P. 373
CHAP TER 1 2. 1 Braking systems
1.2 Optimum k Front axle For the front of the vehicle the adhesion utilization
k limit Rear axle is defined by:
1.0 T f
Adhesion utilization 0.8 Front a f ¼ R f (12.1.61)
f
axle
lock
0.6
The vertical axle load is defined by equation 12.1.37
0.4
Rear and the front axle brake force, expressed as a proportion
of the total is x f Pz, leads to:
axle
0.2 lock
x Pz
f
f ¼ (12.1.62)
f
0 Pzh
f
0.0 0.1 0.2 0.3 0.4 0.5 0.6 0.7 0.8 0.9 1.0 1.1 1.2 F þ l
Deceleration (g)
Similarly, for the rear of the vehicle:
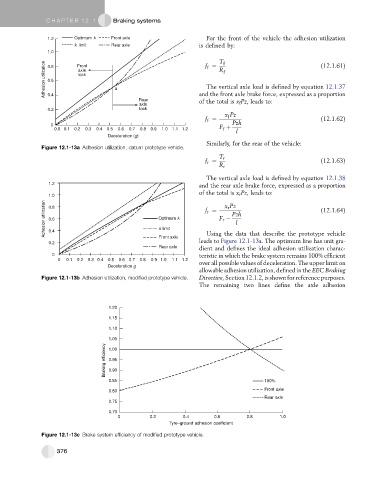
Figure 12.1-13a Adhesion utilization, datum prototype vehicle.
T r
f r ¼ (12.1.63)
R r
The vertical axle load is defined by equation 12.1.38
1.2
and the rear axle brake force, expressed as a proportion
of the total is x r Pz, leads to:
1.0 x r Pz
Adhesion utilization 0.8 Optimum k f r ¼ F r Pzh (12.1.64)
0.6
l
k limit
0.4
Using the data that describe the prototype vehicle
0.2 Front axle leads to Figure 12.1-13a. The optimum line has unit gra-
Rear axle dient and defines the ideal adhesion utilization charac-
0 teristic in which the brake system remains 100% efficient
0 0.1 0.2 0.3 0.4 0.5 0.6 0.7 0.8 0.9 1.0 1.1 1.2
over all possible values of deceleration. The upper limit on
Deceleration g
allowable adhesion utilization, defined in the EEC Braking
Figure 12.1-13b Adhesion utilization, modified prototype vehicle. Directive, Section 12.1.2, is shown for reference purposes.
The remaining two lines define the axle adhesion
1.20
1.15
1.10
1.05
Braking efficiency 0.95
1.00
0.90
0.85 100%
Front axle
0.80
Rear axle
0.75
0.70
0 0.2 0.4 0.6 0.8 1.0
Tyre–ground adhesion coefficient
Figure 12.1-13c Brake system efficiency of modified prototype vehicle.
376