
Page 507 - Automotive Engineering Powertrain Chassis System and Vehicle Body
P. 507
Modelling and assembly of the full vehicle C HAPTER 15.1
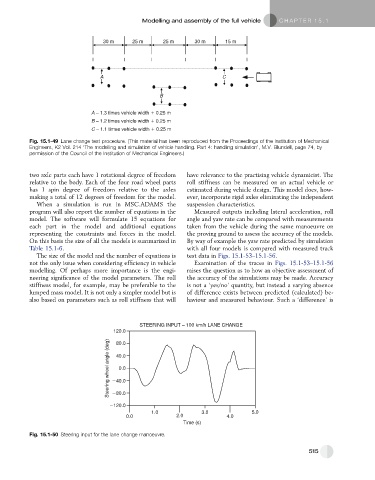
30 m 25 m 25 m 30 m 15 m
A C
B
A – 1.3 times vehicle width 0.25 m
B – 1.2 times vehicle width 0.25 m
C – 1.1 times vehicle width 0.25 m
Fig. 15.1-49 Lane change test procedure. (This material has been reproduced from the Proceedings of the Institution of Mechanical
Engineers, K2 Vol. 214 ‘The modelling and simulation of vehicle handling. Part 4: handling simulation’, M.V. Blundell, page 74, by
permission of the Council of the Institution of Mechanical Engineers.)
two axle parts each have 1 rotational degree of freedom have relevance to the practising vehicle dynamicist. The
relative to the body. Each of the four road wheel parts roll stiffness can be measured on an actual vehicle or
has 1 spin degree of freedom relative to the axles estimated during vehicle design. This model does, how-
making a total of 12 degrees of freedom for the model. ever, incorporate rigid axles eliminating the independent
When a simulation is run in MSC.ADAMS the suspension characteristics.
program will also report the number of equations in the Measured outputs including lateral acceleration, roll
model. The software will formulate 15 equations for angle and yaw rate can be compared with measurements
each part in the model and additional equations taken from the vehicle during the same manoeuvre on
representing the constraints and forces in the model. the proving ground to assess the accuracy of the models.
On this basis the size of all the models is summarized in By way of example the yaw rate predicted by simulation
Table 15.1-6. with all four models is compared with measured track
The size of the model and the number of equations is test data in Figs. 15.1-53–15.1-56.
not the only issue when considering efficiency in vehicle Examination of the traces in Figs. 15.1-53–15.1-56
modelling. Of perhaps more importance is the engi- raises the question as to how an objective assessment of
neering significance of the model parameters. The roll the accuracy of the simulations may be made. Accuracy
stiffness model, for example, may be preferable to the is not a ‘yes/no’ quantity, but instead a varying absence
lumped mass model. It is not only a simpler model but is of difference exists between predicted (calculated) be-
also based on parameters such as roll stiffness that will haviour and measured behaviour. Such a ‘difference’ is
STEERING INPUT – 100 km/h LANE CHANGE
120.0
Steering wheel angle (deg) 40.0
80.0
40.0
0.0
80.0
120.0
1.0 3.0 5.0
0.0 2.0 4.0
Time (s)
Fig. 15.1-50 Steering input for the lane change manoeuvre.
515