
Page 508 - Automotive Engineering Powertrain Chassis System and Vehicle Body
P. 508
CHAP TER 1 5. 1 Modelling and assembly of the full vehicle
simulated results for the peaks in the response or to sum
the overall error from start to finish. On that basis it may
seem desirable to somehow ‘score’ the models giving, say,
the linkage model 8/10 and the roll stiffness model 7/10.
In light of the above questions the validity of such an
objective measure is debatable and it is probably more
appropriate to simply state:
For this vehicle, this manoeuvre, the model data, and
the available benchmark test data the equivalent roll
stiffness model provides reliable predictions when
compared with the linkage model for considerably
less investment in model elaboration.
Clearly it is also possible to use an understanding of the
physics of the problem to aid the interpretation of
model performance. An important aspect of the pre-
dictive models is whether the simplified suspension
models correctly distribute load to each tyre and model
the tyre position and orientation in a way that will allow
a good tyre model to determine forces in the tyre
contact patch that impart motion to the vehicle and
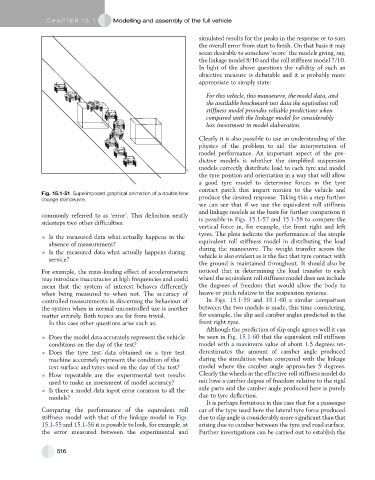
Fig. 15.1-51 Superimposed graphical animation of a double lane
change manoeuvre. produce the desired response. Taking this a step further
we can see that if we use the equivalent roll stiffness
and linkage models as the basis for further comparison it
commonly referred to as ‘error’. This definition neatly
is possible in Figs. 15.1-57 and 15.1-58 to compare the
sidesteps two other difficulties:
vertical force in, for example, the front right and left
tyres. The plots indicate the performance of the simple
Is the measured data what actually happens in the
absence of measurement? equivalent roll stiffness model in distributing the load
during the manoeuvre. The weight transfer across the
Is the measured data what actually happens during
service? vehicle is also evident as is the fact that tyre contact with
the ground is maintained throughout. It should also be
For example, the mass-loading effect of accelerometers noticed that in determining the load transfer to each
may introduce inaccuracies at high frequencies and could wheel the equivalent roll stiffness model does not include
mean that the system of interest behaves differently the degrees of freedom that would allow the body to
when being measured to when not. The accuracy of heave or pitch relative to the suspension systems.
controlled measurements in discerning the behaviour of In Figs. 15.1-59 and 15.1-60 a similar comparison
the system when in normal uncontrolled use is another between the two models is made, this time considering,
matter entirely. Both topics are far from trivial. for example, the slip and camber angles predicted in the
In this case other questions arise such as: front right tyre.
Although the prediction of slip angle agrees well it can
Does the model data accurately represent the vehicle be seen in Fig. 15.1-60 that the equivalent roll stiffness
conditions on the day of the test? model with a maximum value of about 1.5 degrees un-
Does the tyre test data obtained on a tyre test derestimates the amount of camber angle produced
machine accurately represent the condition of the during the simulation when compared with the linkage
test surface and tyres used on the day of the test? model where the camber angle approaches 5 degrees.
How repeatable are the experimental test results Clearly the wheels in the effective roll stiffness model do
used to make an assessment of model accuracy? not have a camber degree of freedom relative to the rigid
axle parts and the camber angle produced here is purely
Is there a model data input error common to all the
models? due to tyre deflection.
It is perhaps fortuitous in this case that for a passenger
Comparing the performance of the equivalent roll car of the type used here the lateral tyre force produced
stiffness model with that of the linkage model in Figs. due to slip angle is considerably more significant than that
15.1-55 and 15.1-56 it is possible to look, for example, at arising due to camber between the tyre and road surface.
the error measured between the experimental and Further investigations can be carried out to establish the
516