
Page 161 - Biomedical Engineering and Design Handbook Volume 1, Fundamentals
P. 161
138 BIOMECHANICS OF THE HUMAN BODY
Low Pass Butterworth Filter
580
575 Raw
6 Hz (padded)
570
6 Hz (not padded)
565
mm 560
555
550
545
540
0 20 40 60 80 100
% Stance
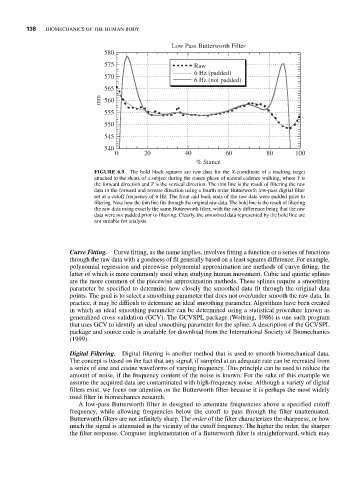
FIGURE 6.9 The bold black squares are raw data for the X-coordinate of a tracking target
attached to the shank of a subject during the stance phase of natural cadence walking, where Y is
the forward direction and Z is the vertical direction. The thin line is the result of filtering the raw
data in the forward and reverse direction using a fourth order Butterworth low-pass digital filter
set at a cutoff frequency of 6 Hz. The front and back ends of the raw data were padded prior to
filtering. Note how the thin line fits through the original raw data. The bold line is the result of filtering
the raw data using exactly the same Butterworth filter, with the only difference being that the raw
data were not padded prior to filtering. Clearly, the smoothed data represented by the bold line are
not suitable for analysis.
Curve Fitting. Curve fitting, as the name implies, involves fitting a function or a series of functions
through the raw data with a goodness of fit generally based on a least squares difference. For example,
polynomial regression and piecewise polynomial approximation are methods of curve fitting, the
latter of which is more commonly used when studying human movement. Cubic and quintic splines
are the more common of the piecewise approximation methods. These splines require a smoothing
parameter be specified to determine how closely the smoothed data fit through the original data
points. The goal is to select a smoothing parameter that does not over/under smooth the raw data. In
practice, it may be difficult to determine an ideal smoothing parameter. Algorithms have been created
in which an ideal smoothing parameter can be determined using a statistical procedure known as
generalized cross validation (GCV). The GCVSPL package (Woltring, 1986) is one such program
that uses GCV to identify an ideal smoothing parameter for the spline. A description of the GCVSPL
package and source code is available for download from the International Society of Biomechanics
(1999).
Digital Filtering. Digital filtering is another method that is used to smooth biomechanical data.
The concept is based on the fact that any signal, if sampled at an adequate rate can be recreated from
a series of sine and cosine waveforms of varying frequency. This principle can be used to reduce the
amount of noise, if the frequency content of the noise is known. For the sake of this example we
assume the acquired data are contaminated with high-frequency noise. Although a variety of digital
filters exist, we focus our attention on the Butterworth filter because it is perhaps the most widely
used filter in biomechanics research.
A low-pass Butterworth filter is designed to attenuate frequencies above a specified cutoff
frequency, while allowing frequencies below the cutoff to pass through the filter unattenuated.
Butterworth filters are not infinitely sharp. The order of the filter characterizes the sharpness, or how
much the signal is attenuated in the vicinity of the cutoff frequency. The higher the order, the sharper
the filter response. Computer implementation of a Butterworth filter is straightforward, which may