
Page 160 - Biomedical Engineering and Design Handbook Volume 1, Fundamentals
P. 160
BIOMECHANICS OF HUMAN MOVEMENT 137
F Ky
M Kz
F Kx
m g
s
–M Az
–F Ax
–F Ay
Y F Ay
F E
X
F Ax
M Az
F E
m g
f
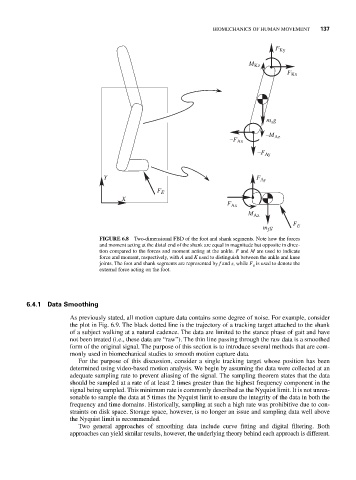
FIGURE 6.8 Two-dimensional FBD of the foot and shank segments. Note how the forces
and moment acting at the distal end of the shank are equal in magnitude but opposite in direc-
tion compared to the forces and moment acting at the ankle. F and M are used to indicate
force and moment, respectively, with A and K used to distinguish between the ankle and knee
joints. The foot and shank segments are represented by f and s, while F is used to denote the
E
external force acting on the foot.
6.4.1 Data Smoothing
As previously stated, all motion capture data contains some degree of noise. For example, consider
the plot in Fig. 6.9. The black dotted line is the trajectory of a tracking target attached to the shank
of a subject walking at a natural cadence. The data are limited to the stance phase of gait and have
not been treated (i.e., these data are “raw”). The thin line passing through the raw data is a smoothed
form of the original signal. The purpose of this section is to introduce several methods that are com-
monly used in biomechanical studies to smooth motion capture data.
For the purpose of this discussion, consider a single tracking target whose position has been
determined using video-based motion analysis. We begin by assuming the data were collected at an
adequate sampling rate to prevent aliasing of the signal. The sampling theorem states that the data
should be sampled at a rate of at least 2 times greater than the highest frequency component in the
signal being sampled. This minimum rate is commonly described as the Nyquist limit. It is not unrea-
sonable to sample the data at 5 times the Nyquist limit to ensure the integrity of the data in both the
frequency and time domains. Historically, sampling at such a high rate was prohibitive due to con-
straints on disk space. Storage space, however, is no longer an issue and sampling data well above
the Nyquist limit is recommended.
Two general approaches of smoothing data include curve fitting and digital filtering. Both
approaches can yield similar results, however, the underlying theory behind each approach is different.