
Page 220 - Cam Design Handbook
P. 220
THB7 8/15/03 1:58 PM Page 208
208 CAM DESIGN HANDBOOK
25
20
15
Pressure angle (degrees) –5 5 0
10
–10
–15
–20
–25
0 50 100 150 200 250 300 350
y (deg)
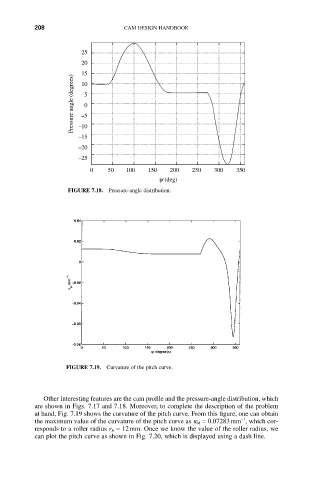
FIGURE 7.18. Pressure-angle distribution.
FIGURE 7.19. Curvature of the pitch curve.
Other interesting features are the cam profile and the pressure-angle distribution, which
are shown in Figs. 7.17 and 7.18. Moreover, to complete the description of the problem
at hand, Fig. 7.19 shows the curvature of the pitch curve. From this figure, one can obtain
-1
the maximum value of the curvature of the pitch curve as k M = 0.07283mm , which cor-
responds to a roller radius r R = 12mm. Once we know the value of the roller radius, we
can plot the pitch curve as shown in Fig. 7.20, which is displayed using a dash line.