
Page 309 - Classification Parameter Estimation & State Estimation An Engg Approach Using MATLAB
P. 309
298 STATE ESTIMATION IN PRACTICE
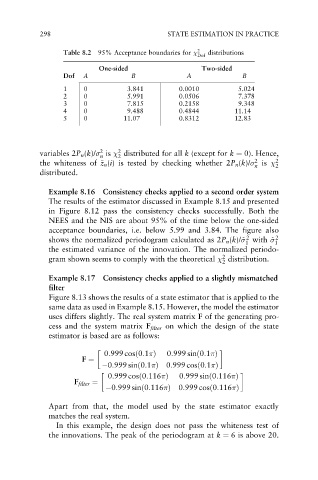
Table 8.2 95% Acceptance boundaries for 2 distributions
Dof
One-sided Two-sided
Dof A B A B
1 0 3.841 0.0010 5.024
2 0 5.991 0.0506 7.378
3 0 7.815 0.2158 9.348
4 0 9.488 0.4844 11.14
5 0 11.07 0.8312 12.83
2
2
variables 2P n (k)/ is distributed for all k (except for k ¼ 0). Hence,
n 2
2
z
the whiteness of ~ z n (i) is tested by checking whether 2P n (k)/ is 2
n 2
distributed.
Example 8.16 Consistency checks applied to a second order system
The results of the estimator discussed in Example 8.15 and presented
in Figure 8.12 pass the consistency checks successfully. Both the
NEES and the NIS are about 95% of the time below the one-sided
acceptance boundaries, i.e. below 5.99 and 3.84. The figure also
2
shows the normalized periodogram calculated as 2P n (k)/^ with ^ 1 2
1
the estimated variance of the innovation. The normalized periodo-
2
gram shown seems to comply with the theoretical distribution.
2
Example 8.17 Consistency checks applied to a slightly mismatched
filter
Figure 8.13 shows the results of a state estimator that is applied to the
same data as used in Example 8.15. However, the model the estimator
uses differs slightly. The real system matrix F of the generating pro-
cess and the system matrix F filter on which the design of the state
estimator is based are as follows:
0:999 cosð0:1 Þ 0:999 sinð0:1 Þ
F ¼
0:999 sinð0:1 Þ 0:999 cosð0:1 Þ
0:999 cosð0:116 Þ 0:999 sinð0:116 Þ
F filter ¼
0:999 sinð0:116 Þ 0:999 cosð0:116 Þ
Apart from that, the model used by the state estimator exactly
matches the real system.
In this example, the design does not pass the whiteness test of
the innovations. The peak of the periodogram at k ¼ 6 is above 20.