
Page 140 - Computational Statistics Handbook with MATLAB
P. 140
Chapter 5: Exploratory Data Analysis 127
BL
L
E
B
T
AB
A
E
T T A B LE L E 5.1 5.1
TA
5.1
5.1
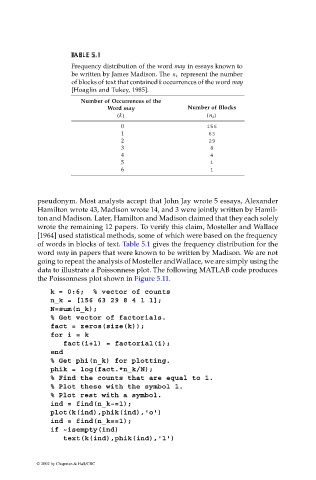
Frequency distribution of the word may in essays known to
represent the number
be written by James Madison. The n k
of blocks of text that contained k occurrences of the word may
[Hoaglin and Tukey, 1985].
Number of Occurrences of the
Word may Number of Blocks
k () ( n k )
0 156
1 63
2 29
3 8
4 4
5 1
6 1
pseudonym. Most analysts accept that John Jay wrote 5 essays, Alexander
Hamilton wrote 43, Madison wrote 14, and 3 were jointly written by Hamil-
ton and Madison. Later, Hamilton and Madison claimed that they each solely
wrote the remaining 12 papers. To verify this claim, Mosteller and Wallace
[1964] used statistical methods, some of which were based on the frequency
of words in blocks of text. Table 5.1 gives the frequency distribution for the
word may in papers that were known to be written by Madison. We are not
going to repeat the analysis of Mosteller and Wallace, we are simply using the
data to illustrate a Poissonness plot. The following MATLAB code produces
the Poissonness plot shown in Figure 5.11.
k = 0:6; % vector of counts
n_k = [156 63 29 8 4 1 1];
N=sum(n_k);
% Get vector of factorials.
fact = zeros(size(k));
for i = k
fact(i+1) = factorial(i);
end
% Get phi(n_k) for plotting.
phik = log(fact.*n_k/N);
% Find the counts that are equal to 1.
% Plot these with the symbol 1.
% Plot rest with a symbol.
ind = find(n_k~=1);
plot(k(ind),phik(ind),'o')
ind = find(n_k==1);
if ~isempty(ind)
text(k(ind),phik(ind),'1')
© 2002 by Chapman & Hall/CRC