Page 138 - Computational Statistics Handbook with MATLAB
P. 138

Chapter 5: Exploratory Data Analysis                            125


                                        3


                                        2
                                      Standard Normal Quantiles  −1

                                        1

                                        0


                                       −2

                                       −3
                                        −3     −2    −1     0      1     2      3     4
                                                            Sorted Data
                               IG
                              FI F U URE G 5.  RE 5. 9  9
                               GU
                                     9
                              F F II  GU  RE RE 5. 5.  9
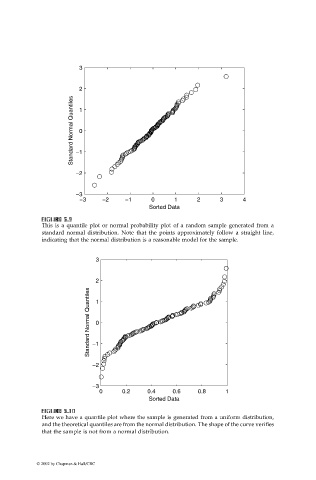
                              This  is a quantile  plot or  normal  probability plot  of a  random sample  generated from  a
                              standard  normal  distribution. Note that the  points approximately follow a straight line,
                              indicating that the normal distribution is a reasonable model for the sample.
                                             3
                                             2
                                           Standard Normal Quantiles  −1
                                             1


                                             0


                                            −2


                                            −3
                                              0     0.2    0.4    0.6    0.8     1
                                                            Sorted Data

                               II
                               U
                              F FI F F IG URE G 5.10  RE RE RE 5.10
                               GU
                                  5.10
                                  5.10
                               GU
                              Here we have a quantile plot where the sample is generated from a uniform distribution,
                              and the theoretical quantiles are from the normal distribution. The shape of the curve verifies
                              that the sample is not from a normal distribution.
                            © 2002 by Chapman & Hall/CRC
   133   134   135   136   137   138   139   140   141   142   143