
Page 150 - Computational Statistics Handbook with MATLAB
P. 150
Chapter 5: Exploratory Data Analysis 137
4.5
4
3.5
3
2.5
2
0 0.5 1 1.5 2 2.5 3 3.5
IG
FI F U URE G 5.1 RE 5.1 6 6
GU
5.1
F F II GU RE RE 5.1 6 6
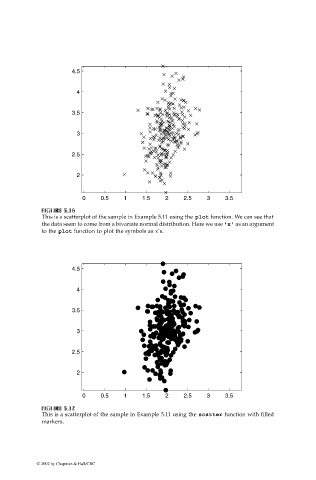
This is a scatterplot of the sample in Example 5.11 using the plot function. We can see that
the data seem to come from a bivariate normal distribution. Here we use 'x' as an argument
to the plot function to plot the symbols as x’s.
4.5
4
3.5
3
2.5
2
0 0.5 1 1.5 2 2.5 3 3.5
U
F FI IG URE G 5.1 RE 5.1 7 7
5.1
GU
F F II GU RE RE 5.1 7 7
This is a scatterplot of the sample in Example 5.11 using the scatter function with filled
markers.
© 2002 by Chapman & Hall/CRC