
Page 153 - Computational Statistics Handbook with MATLAB
P. 153
140 Computational Statistics Handbook with MATLAB
3
4
2
8
0 6
1 2
−2
0
0
2
−1 −2
−4 0
−6
−2
−3
−3 −2 −1 0 1 2 3
FI F U URE G 5.1 RE 5.1 9 9
IG
F F II GU RE RE 5.1 9 9
5.1
GU
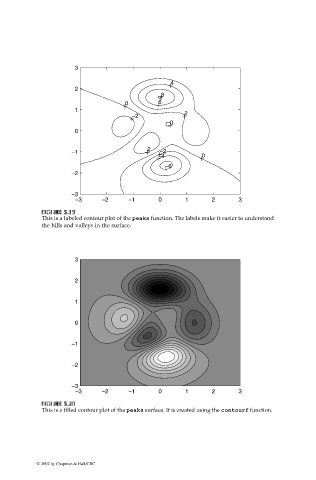
This is a labeled contour plot of the peaks function. The labels make it easier to understand
the hills and valleys in the surface.
3
2
1
0
−1
−2
−3
−3 −2 −1 0 1 2 3
IG
F FI U URE G 5.2 RE 5.2 0 0
F F II GU RE RE 5.2 0 0
5.2
GU
This is a filled contour plot of the peaks surface. It is created using the contourf function.
© 2002 by Chapman & Hall/CRC