
Page 157 - Computational Statistics Handbook with MATLAB
P. 157
144 Computational Statistics Handbook with MATLAB
0.1
0.05
0
IG
GU
5.2
II
F FI F F U URE GU 5.2 RE RE RE 5.2 3 3 3 3
5.2
G
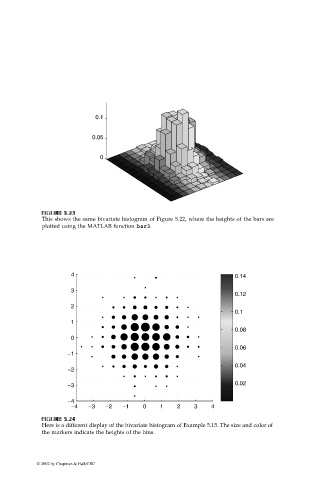
This shows the same bivariate histogram of Figure 5.22, where the heights of the bars are
plotted using the MATLAB function bar3.
4 0.14
3
0.12
2
0.1
1
0.08
0
0.06
−1
0.04
−2
−3 0.02
−4
−4 −3 −2 −1 0 1 2 3 4
U
F FI IG URE G 5.2 RE 5.2 4 4
F F II GU RE RE 5.2 4 4
GU
5.2
Here is a different display of the bivariate histogram of Example 5.15. The size and color of
the markers indicate the heights of the bins.
© 2002 by Chapman & Hall/CRC