
Page 160 - Computational Statistics Handbook with MATLAB
P. 160
Chapter 5: Exploratory Data Analysis 147
60
Maximal Width of Aedegus 50
55
45
40
160
250
140
200
120
150
Width 2nd Tarsus 100 100 Width 1st Tarsus
U
FI F IG URE G 5.2 RE 5.2 5 5
F F II GU RE RE 5.2 5 5
5.2
GU
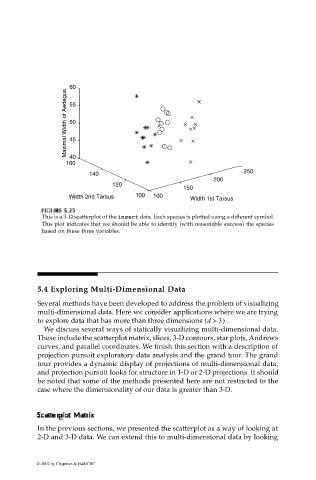
This is a 3-D scatterplot of the insect data. Each species is plotted using a different symbol.
This plot indicates that we should be able to identify (with reasonable success) the species
based on these three variables.
5.4 Exploring Multi-Dimensional Data
Several methods have been developed to address the problem of visualizing
multi-dimensional data. Here we consider applications where we are trying
to explore data that has more than three dimensions d >( 3) .
We discuss several ways of statically visualizing multi-dimensional data.
These include the scatterplot matrix, slices, 3-D contours, star plots, Andrews
curves, and parallel coordinates. We finish this section with a description of
projection pursuit exploratory data analysis and the grand tour. The grand
tour provides a dynamic display of projections of multi-dimensional data,
and projection pursuit looks for structure in 1-D or 2-D projections. It should
be noted that some of the methods presented here are not restricted to the
case where the dimensionality of our data is greater than 3-D.
SSccaatt tterplotterplot terplotterplot MatMatr MatMat xix
Scaat
rr ixix
Sc
ri
In the previous sections, we presented the scatterplot as a way of looking at
2-D and 3-D data. We can extend this to multi-dimensional data by looking
© 2002 by Chapman & Hall/CRC