
Page 161 - Computational Statistics Handbook with MATLAB
P. 161
148 Computational Statistics Handbook with MATLAB
at 2-D scatterplots of all possible pairs of variables. This allows one to view
pairwise relationships and to look for interesting structures in two dimen-
sions. MATLAB provides a function called plotmatrix that will create a
scatterplot matrix. Its use is illustrated below.
Example 5.17
The iris data are well-known to statisticians and are often used to illustrate
classification, clustering or visualization techniques. The data were collected
by Anderson [1935] and were analyzed by Fisher [1936], so the data are often
called Fisher’s iris data by statisticians. The data consist of 150 observations
containing four measurements based on the petals and sepals of three species
of iris. These three species are: Iris setosa, Iris virginica and Iris versicolor. We
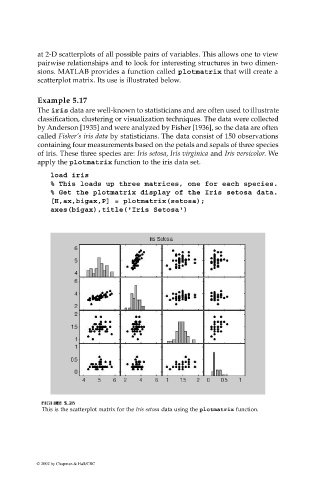
apply the plotmatrix function to the iris data set.
load iris
% This loads up three matrices, one for each species.
% Get the plotmatrix display of the Iris setosa data.
[H,ax,bigax,P] = plotmatrix(setosa);
axes(bigax),title('Iris Setosa')
F FI U URE G 5.2 RE 5.2 6 6
IG
5.2
F F II GU RE RE 5.2 6 6
GU
This is the scatterplot matrix for the Iris setosa data using the plotmatrix function.
© 2002 by Chapman & Hall/CRC