
Page 201 - Defrosting for Air Source Heat Pump
P. 201
The influence of refrigerant distribution on defrosting 195
vary the refrigerant flow to each circuit, according to the tube surface temperature at
the exit of each circuit.
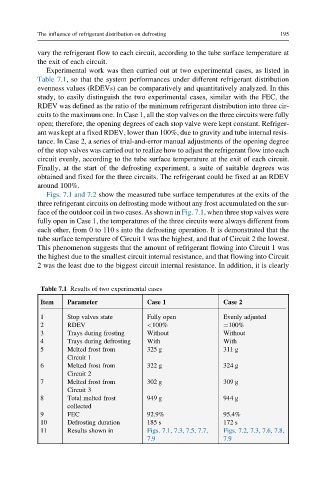
Experimental work was then carried out at two experimental cases, as listed in
Table 7.1, so that the system performances under different refrigerant distribution
evenness values (RDEVs) can be comparatively and quantitatively analyzed. In this
study, to easily distinguish the two experimental cases, similar with the FEC, the
RDEV was defined as the ratio of the minimum refrigerant distribution into three cir-
cuits to the maximum one. In Case 1, all the stop valves on the three circuits were fully
open; therefore, the opening degrees of each stop valve were kept constant. Refriger-
ant was kept at a fixed RDEV, lower than 100%, due to gravity and tube internal resis-
tance. In Case 2, a series of trial-and-error manual adjustments of the opening degree
of the stop valves was carried out to realize how to adjust the refrigerant flow into each
circuit evenly, according to the tube surface temperature at the exit of each circuit.
Finally, at the start of the defrosting experiment, a suite of suitable degrees was
obtained and fixed for the three circuits. The refrigerant could be fixed at an RDEV
around 100%.
Figs. 7.1 and 7.2 show the measured tube surface temperatures at the exits of the
three refrigerant circuits on defrosting mode without any frost accumulated on the sur-
face of the outdoor coil in two cases. As shown in Fig. 7.1, when three stop valves were
fully open in Case 1, the temperatures of the three circuits were always different from
each other, from 0 to 110 s into the defrosting operation. It is demonstrated that the
tube surface temperature of Circuit 1 was the highest, and that of Circuit 2 the lowest.
This phenomenon suggests that the amount of refrigerant flowing into Circuit 1 was
the highest due to the smallest circuit internal resistance, and that flowing into Circuit
2 was the least due to the biggest circuit internal resistance. In addition, it is clearly
Table 7.1 Results of two experimental cases
Item Parameter Case 1 Case 2
1 Stop valves state Fully open Evenly adjusted
2 RDEV <100% ¼100%
3 Trays during frosting Without Without
4 Trays during defrosting With With
5 Melted frost from 325 g 311 g
Circuit 1
6 Melted frost from 322 g 324 g
Circuit 2
7 Melted frost from 302 g 309 g
Circuit 3
8 Total melted frost 949 g 944 g
collected
9 FEC 92.9% 95.4%
10 Defrosting duration 185 s 172 s
11 Results shown in Figs. 7.1, 7.3, 7.5, 7.7, Figs. 7.2, 7.3, 7.6, 7.8,
7.9 7.9