
Page 206 - Defrosting for Air Source Heat Pump
P. 206
200 Defrosting for Air Source Heat Pump
1.6
Case 1 Case 2
1.4
Refrigerant volumetric flow rate (L / min) 1.0
1.2
0.8
0.6
0.4
R
Case 2
0.2
70 s
155 s
0.0 Fluctuating 90 s > R Case1 170 s
0 20 40 60 80 100 120 140 160 180 200
Time (s)
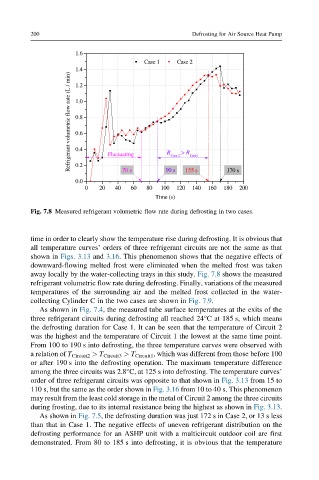
Fig. 7.8 Measured refrigerant volumetric flow rate during defrosting in two cases.
time in order to clearly show the temperature rise during defrosting. It is obvious that
all temperature curves’ orders of three refrigerant circuits are not the same as that
shown in Figs. 3.13 and 3.16. This phenomenon shows that the negative effects of
downward-flowing melted frost were eliminated when the melted frost was taken
away locally by the water-collecting trays in this study. Fig. 7.8 shows the measured
refrigerant volumetric flow rate during defrosting. Finally, variations of the measured
temperatures of the surrounding air and the melted frost collected in the water-
collecting Cylinder C in the two cases are shown in Fig. 7.9.
As shown in Fig. 7.4, the measured tube surface temperatures at the exits of the
three refrigerant circuits during defrosting all reached 24°C at 185 s, which means
the defrosting duration for Case 1. It can be seen that the temperature of Circuit 2
was the highest and the temperature of Circuit 1 the lowest at the same time point.
From 100 to 190 s into defrosting, the three temperature curves were observed with
a relation of T Circuit2 > T Circuit3 > T Circuit1 , which was different from those before 100
or after 190 s into the defrosting operation. The maximum temperature difference
among the three circuits was 2.8°C, at 125 s into defrosting. The temperature curves’
order of three refrigerant circuits was opposite to that shown in Fig. 3.13 from 15 to
110 s, but the same as the order shown in Fig. 3.16 from 10 to 40 s. This phenomenon
may result from the least cold storage in the metal of Circuit 2 among the three circuits
during frosting, due to its internal resistance being the highest as shown in Fig. 3.13.
As shown in Fig. 7.5, the defrosting duration was just 172 s in Case 2, or 13 s less
than that in Case 1. The negative effects of uneven refrigerant distribution on the
defrosting performance for an ASHP unit with a multicircuit outdoor coil are first
demonstrated. From 80 to 185 s into defrosting, it is obvious that the temperature