
Page 207 - Defrosting for Air Source Heat Pump
P. 207
The influence of refrigerant distribution on defrosting 201
1.4
Case 1 Case 2
1.2
1.0
Temperature of
0.8 melted frost collected
Temperature ( o C) 0.6 Temperature of
0.4
surrounding air
0.2
140 s
0.0
120 s
–0.2
0 50 100 150 200 250 300
Time (s)
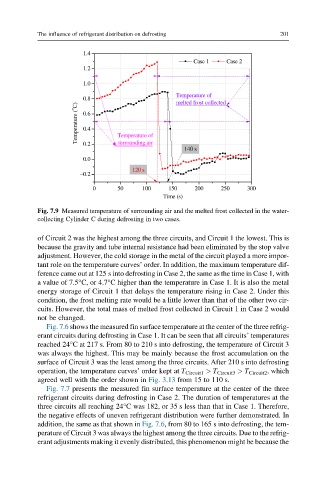
Fig. 7.9 Measured temperature of surrounding air and the melted frost collected in the water-
collecting Cylinder C during defrosting in two cases.
of Circuit 2 was the highest among the three circuits, and Circuit 1 the lowest. This is
because the gravity and tube internal resistance had been eliminated by the stop valve
adjustment. However, the cold storage in the metal of the circuit played a more impor-
tant role on the temperature curves’ order. In addition, the maximum temperature dif-
ference came out at 125 s into defrosting in Case 2, the same as the time in Case 1, with
a value of 7.5°C, or 4.7°C higher than the temperature in Case 1. It is also the metal
energy storage of Circuit 1 that delays the temperature rising in Case 2. Under this
condition, the frost melting rate would be a little lower than that of the other two cir-
cuits. However, the total mass of melted frost collected in Circuit 1 in Case 2 would
not be changed.
Fig. 7.6 shows the measured fin surface temperature at the center of the three refrig-
erant circuits during defrosting in Case 1. It can be seen that all circuits’ temperatures
reached 24°C at 217 s. From 80 to 210 s into defrosting, the temperature of Circuit 3
was always the highest. This may be mainly because the frost accumulation on the
surface of Circuit 3 was the least among the three circuits. After 210 s into defrosting
operation, the temperature curves’ order kept at T Circuit1 > T Circuit3 > T Circuit2 , which
agreed well with the order shown in Fig. 3.13 from 15 to 110 s.
Fig. 7.7 presents the measured fin surface temperature at the center of the three
refrigerant circuits during defrosting in Case 2. The duration of temperatures at the
three circuits all reaching 24°C was 182, or 35 s less than that in Case 1. Therefore,
the negative effects of uneven refrigerant distribution were further demonstrated. In
addition, the same as that shown in Fig. 7.6, from 80 to 165 s into defrosting, the tem-
perature of Circuit 3 was always the highest among the three circuits. Due to the refrig-
erant adjustments making it evenly distributed, this phenomenon might be because the