
Page 209 - Defrosting for Air Source Heat Pump
P. 209
The influence of refrigerant distribution on defrosting 203
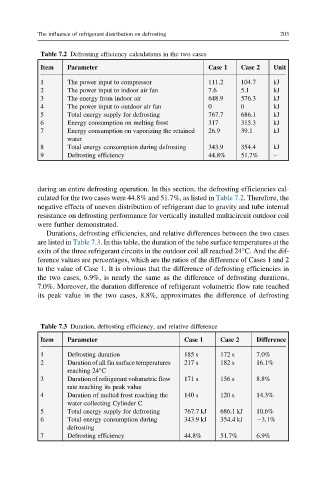
Table 7.2 Defrosting efficiency calculations in the two cases
Item Parameter Case 1 Case 2 Unit
1 The power input to compressor 111.2 104.7 kJ
2 The power input to indoor air fan 7.6 5.1 kJ
3 The energy from indoor air 648.9 576.3 kJ
4 The power input to outdoor air fan 0 0 kJ
5 Total energy supply for defrosting 767.7 686.1 kJ
6 Energy consumption on melting frost 317 315.3 kJ
7 Energy consumption on vaporizing the retained 26.9 39.1 kJ
water
8 Total energy consumption during defrosting 343.9 354.4 kJ
9 Defrosting efficiency 44.8% 51.7% –
during an entire defrosting operation. In this section, the defrosting efficiencies cal-
culated for the two cases were 44.8% and 51.7%, as listed in Table 7.2. Therefore, the
negative effects of uneven distribution of refrigerant due to gravity and tube internal
resistance on defrosting performance for vertically installed multicircuit outdoor coil
were further demonstrated.
Durations, defrosting efficiencies, and relative differences between the two cases
are listed in Table 7.3. In this table, the duration of the tube surface temperatures at the
exits of the three refrigerant circuits in the outdoor coil all reached 24°C. And the dif-
ference values are percentages, which are the ratios of the difference of Cases 1 and 2
to the value of Case 1. It is obvious that the difference of defrosting efficiencies in
the two cases, 6.9%, is nearly the same as the difference of defrosting durations,
7.0%. Moreover, the duration difference of refrigerant volumetric flow rate reached
its peak value in the two cases, 8.8%, approximates the difference of defrosting
Table 7.3 Duration, defrosting efficiency, and relative difference
Item Parameter Case 1 Case 2 Difference
1 Defrosting duration 185 s 172 s 7.0%
2 Duration of all fin surface temperatures 217 s 182 s 16.1%
reaching 24°C
3 Duration of refrigerant volumetric flow 171 s 156 s 8.8%
rate reaching its peak value
4 Duration of melted frost reaching the 140 s 120 s 14.3%
water-collecting Cylinder C
5 Total energy supply for defrosting 767.7 kJ 686.1 kJ 10.6%
6 Total energy consumption during 343.9 kJ 354.4 kJ 3.1%
defrosting
7 Defrosting efficiency 44.8% 51.7% 6.9%