
Page 65 - Digital Analysis of Remotely Sensed Imagery
P. 65
38 Cha pte r T w o
SPOT data are processed to various levels for distribution. Level
1A data are essentially raw data without geometric correction except
normalization of charge coupled device (CCD) detectors. Level 1B
data have been corrected for such geometric distortions as view
angle, Earth rotation and curvature, in addition to the processing
done at level 1A. The extra processing done to level 2A data include
projection to a ground coordinate system. Such corrected images
have a global coordinate system at an absolute positional accuracy
around 500 m. However, the optimal location accuracy can be as high
as approximately 20 m, the most accurate among all processed SPOT
data.
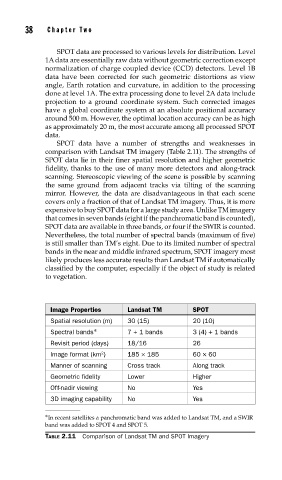
SPOT data have a number of strengths and weaknesses in
comparison with Landsat TM imagery (Table 2.11). The strengths of
SPOT data lie in their finer spatial resolution and higher geometric
fidelity, thanks to the use of many more detectors and along-track
scanning. Stereoscopic viewing of the scene is possible by scanning
the same ground from adjacent tracks via tilting of the scanning
mirror. However, the data are disadvantageous in that each scene
covers only a fraction of that of Landsat TM imagery. Thus, it is more
expensive to buy SPOT data for a large study area. Unlike TM imagery
that comes in seven bands (eight if the panchromatic band is counted),
SPOT data are available in three bands, or four if the SWIR is counted.
Nevertheless, the total number of spectral bands (maximum of five)
is still smaller than TM’s eight. Due to its limited number of spectral
bands in the near and middle infrared spectrum, SPOT imagery most
likely produces less accurate results than Landsat TM if automatically
classified by the computer, especially if the object of study is related
to vegetation.
Image Properties Landsat TM SPOT
Spatial resolution (m) 30 (15) 20 (10)
Spectral bands ∗ 7 + 1 bands 3 (4) + 1 bands
Revisit period (days) 18/16 26
Image format (km ) 185 × 185 60 × 60
2
Manner of scanning Cross track Along track
Geometric fidelity Lower Higher
Off-nadir viewing No Yes
3D imaging capability No Yes
∗ In recent satellites a panchromatic band was added to Landsat TM, and a SWIR
band was added to SPOT 4 and SPOT 5.
TABLE 2.11 Comparison of Landsat TM and SPOT Imagery