
Page 117 - Dynamic Vision for Perception and Control of Motion
P. 117
3.4 Behavioral Capabilities for Locomotion 101
In the (idealized) limit, when IJ decreases to 0 with the product A’· IJ² = A kept
constant (that is, A’ increases strongly, see Figure 3.25), the doublet input function
becomes the derivative of the Dirac impulse:
į () į (t IJ )
t
u lim ( , ) u t IJ | į ( ) . (3.44)
t
idd IJo 0
IJo 0 IJ
This shows that the “idealized” doublet is the second derivative of the step func-
tion and the first derivative of the Dirac impulse; since in the Lapace-domain form-
ing the derivative means multiplication by s, there follows u idd(s) = A·s.
Applying the Laplace transform to Equation 3.38 and grouping terms yields,
with the initial values x La(0),
(sI ) ) x( ) b u ( ) x(0). (3.45)
s
s
La
La
As derived in Appendix B.2, the time responses to the idealized doublet in steer-
ing rate u idd(s) = A·s as input are simple products of the transfer function with this
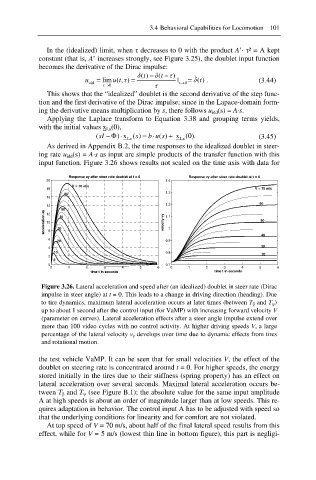
input function. Figure 3.26 shows results not scaled on the time axis with data for
Response ay after steer rate doublet at t = 0 Response vy after steer rate doublet at t = 0
20 1.4
V = 70 m/s
18 V = 70 m/s
60 1.3
16
14 1.2 60
50
acceleration ay 10 30 40 velocity vy 1.1 1 50
12
8
40
6 20 0.9
30
4
10 0.8
2 20
5
0 0.7
0 1 2 3 4 5 6 0 1 2 3 4 5 6
time t in seconds time t in seconds
Figure 3.26. Lateral acceleration and speed after (an idealized) doublet in steer rate (Dirac
impulse in steer angle) at t = 0. This leads to a change in driving direction (heading). Due
to tire dynamics, maximum lateral acceleration occurs at later times (between T ȕ and T ȥ )
up to about 1 second after the control input (for VaMP) with increasing forward velocity V
(parameter on curves). Lateral acceleration effects after a steer angle impulse extend over
more than 100 video cycles with no control activity. At higher driving speeds V, a large
percentage of the lateral velocity v y develops over time due to dynamic effects from tires
and rotational motion.
the test vehicle VaMP. It can be seen that for small velocities V, the effect of the
doublet on steering rate is concentrated around t = 0. For higher speeds, the energy
stored initially in the tires due to their stiffness (spring property) has an effect on
lateral acceleration over several seconds. Maximal lateral acceleration occurs be-
tween T ȕ and T ȥ (see Figure B.1); the absolute value for the same input amplitude
A at high speeds is about an order of magnitude larger than at low speeds. This re-
quires adaptation in behavior. The control input A has to be adjusted with speed so
that the underlying conditions for linearity and for comfort are not violated.
At top speed of V = 70 m/s, about half of the final lateral speed results from this
effect, while for V = 5 m/s (lowest thin line in bottom figure), this part is negligi-