
Page 532 - Engineering Digital Design
P. 532
502 CHAPTER 11 / SYNCHRONOUS FSM DESIGN CONSIDERATIONS
Z(H)
Z(H)
I - T~~V l^ — •"
B(L)- _ __
Hazard cover
A(L)J
Y(H)J 1 Y(H)J
AY(L) J | AY(L) J .
BY(L) J | BY(L) J'
Z(H) U A§(L)i;
" - Static
1 -hazard z(H) J
(a) (b)
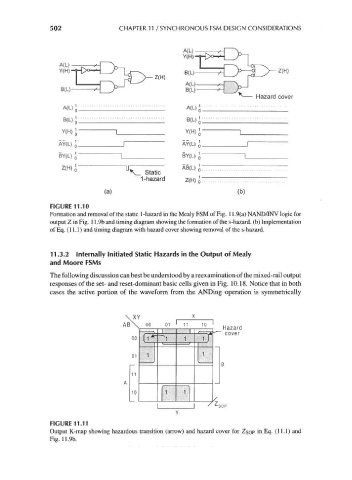
FIGURE 11.10
Formation and removal of the static 1-hazard in the Mealy FSM of Fig. 11.9(a) NAND/INV logic for
output Z in Fig. 11.9b and timing diagram showing the formation of the s-hazard. (b) Implementation
of Eq. (11.1) and timing diagram with hazard cover showing removal of the s-hazard.
11.3.2 Internally Initiated Static Hazards in the Output of Mealy
and Moore FSMs
The following discussion can best be understood by a reexamination of the mixed-rail output
responses of the set- and reset-dominant basic cells given in Fig. 10.18. Notice that in both
cases the active portion of the waveform from the ANDing operation is symmetrically
\ XY X
AB\ 00 01 11 10 Hazard
(1*- 1 if cover
00
1 1
01
11
10 1 1
/ SOP
FIGURE 11.11
Output K-map showing hazardous transition (arrow) and hazard cover for ZSOP in Eq. (11.1) and
Fig. 11.9b.