
Page 569 - Engineering Digital Design
P. 569
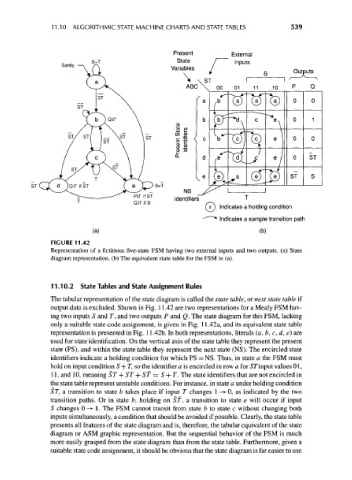
11.10 ALGORITHMIC STATE MACHINE CHARTS AND STATE TABLES              539


                                                     Present         External
                             s+T                      State     /     | np uts
                     Sanity
                              ^                     Variables
                                                       \      ST         I
                                                        ABC \    00 01 11


                                             ST


                                                S+T
                                                        NS
                                                     identifiers
                                                              (x ) Indicates a holding condition
                                                             " * Indicates a sample transition path
                              (a)                                            (b)
                  FIGURE 11.42
                  Representation of a fictitious five-state FSM having two external inputs and two outputs, (a) State
                  diagram representation, (b) The equivalent state table for the FSM in (a).


                  11.10.2 State Tables and State Assignment Rules
                  The tabular representation of the state diagram is called the state table, or next state table if
                  output data is excluded. Shown in Fig. 11.42 are two representations for a Mealy FSM hav-
                  ing two inputs S and T, and two outputs P and Q. The state diagram for this FSM, lacking
                  only a suitable state code assignment, is given in Fig. 11.42a, and its equivalent state table
                  representation is presented in Fig. 11.42b. In both representations, literals (a, b, c, d, e} are
                  used for state identification. On the vertical axis of the state table they represent the present
                  state (PS), and within the state table they represent the next state (NS). The encircled state
                  identifiers indicate a holding condition for which PS = NS. Thus, in state a the FSM must
                  hold on input condition S + T, so the identifier a is encircled in row a for ST input values 01,
                  11, and 10, meaning ST + ST + ST = S + T. The state identifiers that are not encircled in
                  the state table represent unstable conditions. For instance, in state a under holding condition
                  ST, a transition to state b takes place if input T changes 1 —> 0, as indicated by the two
                  transition paths. Or in state b, holding on ST, a transition to state e will occur if input
                  S changes 0 —»• 1. The FSM cannot transit from state b to state c without changing both
                  inputs simultaneously, a condition that should be avoided if possible. Clearly, the state table
                  presents all features of the state diagram and is, therefore, the tabular equivalent of the state
                  diagram or ASM graphic representation. But the sequential behavior of the FSM is much
                  more easily grasped from the state diagram than from the state table. Furthermore, given a
                  suitable state code assignment, it should be obvious that the state diagram is far easier to use