
Page 567 - Engineering Digital Design
P. 567
11.10 ALGORITHMIC STATE MACHINE CHARTS AND STATE TABLES 537
state diagram from which the design can be completed following the indicated procedure.
In this text, the fully documented state diagram is the easiest to work with in carrying out
the design of relatively simple FSMs. There are, however, other useful means of expressing
the sequential behavior of state machines. These other means include the use of algorithmic
state machine (ASM) charts and state tables. The use of these as an aid in constructing the
state diagram will now be explored.
11.10.1 ASM Charts
Just as the flowchart functions as a useful thinking tool in the construction of the state
diagram, so also does the ASM chart serve as a useful thinking tool. In fact, the two are
very similar, the ASM chart being the more useful in creating VHDL FSM descriptions.
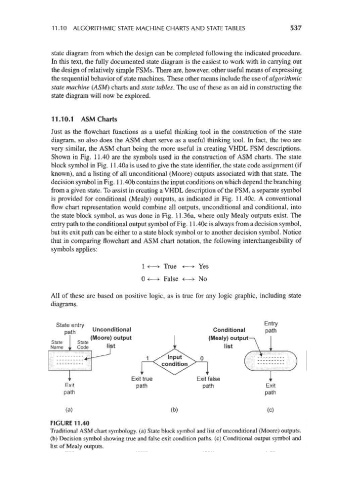
Shown in Fig. 11.40 are the symbols used in the construction of ASM charts. The state
block symbol in Fig. 11.40a is used to give the state identifier, the state code assignment (if
known), and a listing of all unconditional (Moore) outputs associated with that state. The
decision symbol in Fig. 11.40b contains the input conditions on which depend the branching
from a given state. To assist in creating a VHDL description of the FSM, a separate symbol
is provided for conditional (Mealy) outputs, as indicated in Fig. 11.40c. A conventional
flow chart representation would combine all outputs, unconditional and conditional, into
the state block symbol, as was done in Fig. 11.36a, where only Mealy outputs exist. The
entry path to the conditional output symbol of Fig. 11.40c is always from a decision symbol,
but its exit path can be either to a state block symbol or to another decision symbol. Notice
that in comparing flowchart and ASM chart notation, the following interchangeability of
symbols applies:
1 <—> True <—> Yes
0 <—> False <—> No
All of these are based on positive logic, as is true for any logic graphic, including state
diagrams.
State entry Entr Y
path Unconditional Conditional path
(Moore) output (Mealy) output^,
St3l6 .. \
Code list i list \
Exit true Exit false t
path path Exit
path
(a) (b) (c)
FIGURE 11.40
Traditional ASM chart symbology. (a) State block symbol and list of unconditional (Moore) outputs,
(b) Decision symbol showing true and false exit condition paths, (c) Conditional output symbol and
list of Mealy outputs.