
Page 563 - Engineering Digital Design
P. 563
11.9 APPLICATIONS TO THE DESIGN OF MORE COMPLEX STATE MACHINES 533
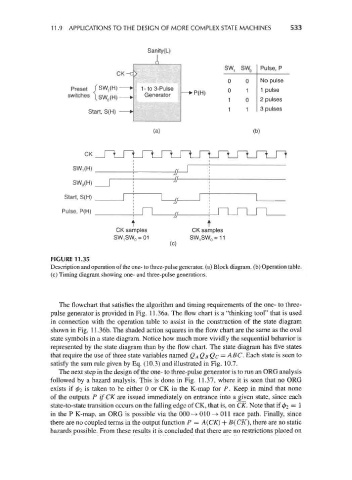
SW SW Pulse, P
CK-C>
0 0 No pulse
Preset J sw,(H) w i-to3-Pulse I 0 -| 1 pulse
P
switches \SW 0(H)—^ Generator \^ W 1 Q g pu|ses
Start, S(H) * 1 1 3 P ulses
(a) (b)
CK
SW^H)
rr
JJ
SW 0(H)
— '
Start, S(H) I
Pulse, P(H)
1 \ *h
CK samples CK samples
SW. SW 0 = 01 S\N< SW 0 = 11
(C)
FIGURE 11.35
Description and operation of the one- to three-pulse generator, (a) Block diagram, (b) Operation table.
(c) Timing diagram showing one- and three-pulse generations.
The flowchart that satisfies the algorithm and timing requirements of the one- to three-
pulse generator is provided in Fig. 11.36a. The flow chart is a "thinking tool" that is used
in connection with the operation table to assist in the construction of the state diagram
shown in Fig. 11.36b. The shaded action squares in the flow chart are the same as the oval
state symbols in a state diagram. Notice how much more vividly the sequential behavior is
represented by the state diagram than by the flow chart. The state diagram has five states
that require the use of three state variables named QAQsQc = ABC. Each state is seen to
satisfy the sum rule given by Eq. (10.3) and illustrated in Fig. 10.7.
The next step in the design of the one- to three-pulse generator is to run an ORG analysis
followed by a hazard analysis. This is done in Fig. 11.37, where it is seen that no ORG
exists if 02 is taken to be either 0 or CK in the K-map for P. Keep in mind that none
of the outputs P if CK are issued immediately on entrance into a given state, since each
state-to-state transition occurs on the falling edge of CK, that is, on CK. Note that if 0 2 = 1
in the P K-map, an ORG is possible via the 000^- 010—>• Oil race path. Finally, since
there are no coupled terms in the output function P = A(CK) + B(CK), there are no static
hazards possible. From these results it is concluded that there are no restrictions placed on