
Page 253 - Failure Analysis Case Studies II
P. 253
23 8
where daldn = fatigue crack growth rate in mm per cycle and AK = stress intensity range = 1.12Ao
,/Z in MPa Jm.
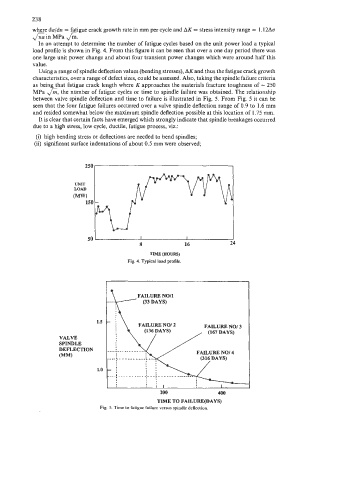
In an attempt to determine the number of fatigue cycles based on the unit power load a typical
load profile is shown in Fig. 4. From this figure it can be seen that over a one day period there was
one large unit power change and about four transient power changes which were around half this
value.
Using a range of spindle deflection values (bending stresses), AKand thus the fatigue crack growth
characteristics, over a range of defect sizes, could be assessed. Also, taking the spindle failure criteria
as bein that fatigue crack length where K approaches the materials fracture toughness of - 250
MPa &, the number of fatigue cycles or time to spindle failure was obtained. The relationship
between valve spindle deflection and time to failure is illustrated in Fig. 5. From Fig. 5 it can be
seen that the four fatigue failures occurred over a valve spindle deflection range of 0.9 to 1.6 mm
and resided somewhat below the maximum spindle deflection possible at this location of 1.75 mm.
It is clear that certain facts have emerged which strongly indicate that spindle breakages occurred
due to a high stress, low cycle, ductile, fatigue process, viz.:
(i) high bending stress or deflections are needed to bend spindles;
(ii) significant surface indentations of about 0.5 mm were observed;
UNIT
LOAD
(MW
150
I I 1
8 16 24
TIME (HOURS)
Fig. 4. Typical load profile.
1.5
FAILURE NO/ 2
VALVE
SPINDLE
DEFLECTION FAILURE NO/ 4
(MM)
1.0
200 400
TIME TO FAIL-AYS)
Fig. 5. Time lo fatigue failure versus spindle deflection.