Page 130 - Fluid Mechanics and Thermodynamics of Turbomachinery
P. 130

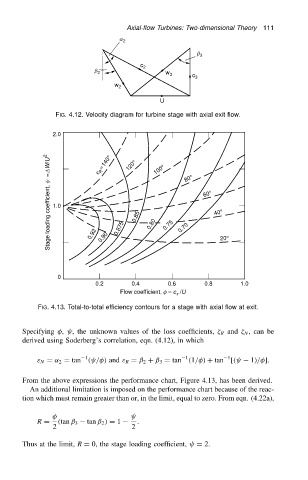
Axial-flow Turbines: Two-dimensional Theory  111
                                                     a 2
                                                                          b 3

                                                          c 2
                                              b 2                w
                                                                  3
                                                                         c 3
                                                   w 2
                                                                U
                                   FIG. 4.12. Velocity diagram for turbine stage with axial exit flow.

                                  2.0


                                 = DW/U 2      e =140°  120°  100°     80°

                                               R
                                 Stage loading coefficient, y  1.0  0.92  0.90  0.875  0.85  0.80  0.75  0.70  60°  40°


                                                                                20°


                                    0
                                              0.2       0.4       0.6       0.8       1.0
                                                     Flow coefficient, f = c  /U
                                                                    x
                              FIG. 4.13. Total-to-total efficiency contours for a stage with axial flow at exit.


                          Specifying  ,  , the unknown values of the loss coefficients,   R and   N , can be
                          derived using Soderberg’s correlation, eqn. (4.12), in which

                                                                                  1
                                                                       1
                                           1
                              ε N D ˛ 2 D tan . / / and ε R D ˇ 2 C ˇ 3 D tan .1/ / C tan [.   1// ].
                          From the above expressions the performance chart, Figure 4.13, has been derived.
                            An additional limitation is imposed on the performance chart because of the reac-
                          tion which must remain greater than or, in the limit, equal to zero. From eqn. (4.22a),


                              R D   .tan ˇ 3  tan ˇ 2 / D 1  .
                                  2                     2

                          Thus at the limit, R D 0, the stage loading coefficient,   D 2.
   125   126   127   128   129   130   131   132   133   134   135