
Page 141 - Fluid-Structure Interactions Slender Structure and Axial Flow (Volume 1)
P. 141
PIPES CONVEYING FLUID: LINEAR DYNAMICS I 123
in Figure 3.37: it is seen that whereas ucf = 4.48 for a! = /3 = (T = 0 (corresponding to
U$ = 20.05 or u:f /n2 = 2.03, the dashed line in the figure), it can be as low as ucf =
3.31 for j3= (T = 0, a!* = 1 (u2 /n2 = 1.107). Furthermore, agreeing with the results of
cf
Figure 3.35 for small /3, external damping ((T* # 0) stabilizes the system.
3.5.4 The S-shaped discontinuities
As already mentioned, the nature of the S-shaped discontinuities in the stability curves of
u versus /3, e.g. in Figures 3.30 and 3.32, is of interest not only per se, but also because the
critical values of B at which these discontinuities occur are frequently associated with, or
are separatrices for, distinctly different dynamical behaviour. The reader is referred to the
discussion of Figures 3.63 and 3.68 in Section 3.6 and Figures 5.19-5.21 of Section 5.7,
as well as to Paidoussis (1997).
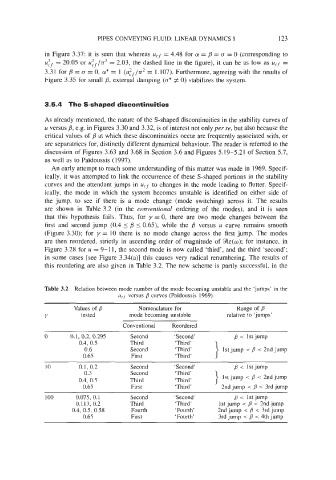
An early attempt to reach some understanding of this matter was made in 1969. Specif-
ically, it was attempted to link the occurrence of these S-shaped portions in the stability
curves and the attendant jumps in uc- to changes in the mode leading to flutter. Specif-
ically, the mode in which the system becomes unstable is identified on either side of
the jump, to see if there is a mode change (mode switching) across it. The results
are shown in Table 3.2 (in the conventional ordering of the modes), and it is seen
that this hypothesis fails. Thus, for y = 0, there are two mode changes between the
first and second jump (0.4 5 B 5 0.65), while the j3 versus u curve remains smooth
(Figure 3.30); for y = 10 there is no mode change across the first jump. The modes
are then reordered, strictly in ascending order of magnitude of %e(@); for instance, in
Figure 3.28 for u = 9- 11, the second mode is now called ‘third’, and the third ‘second’;
in some cases [see Figure 3.34(a)] this causes very radical renumbering. The results of
this reordering are also given in Table 3.2. The new scheme is partly successful, in the
Table 3.2 Relation between mode number of the mode becoming unstable and the ‘jumps’ in the
ucf versus p curves (PaYdoussis 1969).
~
Values of p Nomenclature for Range of p
Y tested mode becoming unstable relative to ‘jumps’
Conventional Reordered
0 0.1, 0.2, 0.295 Second ‘Second’ B < 1st jump
0.4, 0.5 Third ‘Third’
0.6 Second ‘Third’ 1st jump < B < 2nd jump
0.65 First ‘Third’
10 0.1, 0.2 Second ‘Second’ B < 1st jump
0.3 Second ‘Third’
0.4, 0.5 Third } 1st jump < p < 2nd jump
0.65 First ‘Third’ 2nd jump < < 3rd jump
100 0.075, 0.1 Second ‘Second’ p < 1st jump
0.1 13, 0.2 Third ‘Third’ 1st jump < B < 2nd jump
0.4, 0.5, 0.58 Fourth ‘Fourth’ 2nd jump < p < 3rd jump
0.65 First ‘Fourth’ 3rd jump < p < 4th jump