
Page 195 - Foundations of Cognitive Psychology : Core Readings
P. 195
Organizing Objects and Scenes 199
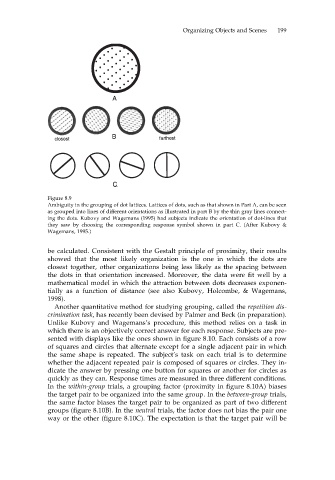
Figure 8.9
Ambiguity in the grouping of dot lattices. Lattices of dots, such as that shown in Part A, can be seen
as grouped into lines of different orientations as illustrated in part B by the thin gray lines connect-
ing the dots. Kubovy and Wagemans (1995) had subjects indicate the orientation of dot-lines that
they saw by choosing the corresponding response symbol shown in part C. (After Kubovy &
Wagemans, 1995.)
be calculated. Consistent with the Gestalt principle of proximity, their results
showed that the most likely organization is the one in which the dots are
closest together, other organizations being less likely as the spacing between
the dots in that orientation increased. Moreover, the data were fit well by a
mathematical model in which the attraction between dots decreases exponen-
tially as a function of distance (see also Kubovy, Holcombe, & Wagemans,
1998).
Another quantitative method for studying grouping, called the repetition dis-
crimination task, has recently been devised by Palmer and Beck (in preparation).
Unlike Kubovy and Wagemans’s procedure, this method relies on a task in
which there is an objectively correct answer for each response. Subjects are pre-
sented with displays like the ones shown in figure 8.10. Each consists of a row
of squares and circles that alternate except for a single adjacent pair in which
the same shape is repeated. The subject’s task on each trial is to determine
whether the adjacent repeated pair is composed of squares or circles. They in-
dicate the answer by pressing one button for squares or another for circles as
quickly as they can. Response times are measured in three different conditions.
In the within-group trials, a grouping factor (proximity in figure 8.10A) biases
the target pair to be organized into the same group. In the between-group trials,
the same factor biases the target pair to be organized as part of two different
groups (figure 8.10B). In the neutral trials, the factor does not bias the pair one
way or the other (figure 8.10C). The expectation is that the target pair will be