
Page 198 - Foundations of Cognitive Psychology : Core Readings
P. 198
202 Stephen E. Palmer
occur early to provide higher-level processes with the perceptual units they re-
quire as input. Indeed, this early view has seldom been seriously questioned, at
least until recently.
As sensible as the early view of grouping appears a priori, however, there
is little empirical evidence to support it. The usual Gestalt demonstrations of
grouping do not address this issue because they employ displays in which depth
and constancy are irrelevant: two-dimensional displays viewed in the frontal
plane with homogeneous illumination. Under these simple conditions it cannot
be determined whether the critical grouping factors operate at the level of 2-D
image structure or that of 3-D perceptual structure. The reason is that in the
Gestalt demonstrations grouping at these two levels—2-D retinal images ver-
sus 3-D percepts—lead to the same predictions.
The first well-controlled experiment to explicitly separate the predictions
of organization at these two levels concerned grouping by proximity (Rock &
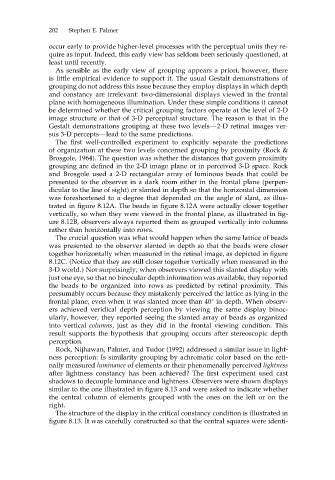
Brosgole, 1964). The question was whether the distances that govern proximity
grouping are defined in the 2-D image plane or in perceived 3-D space. Rock
and Brosgole used a 2-D rectangular array of luminous beads that could be
presented to the observer in a dark room either in the frontal plane (perpen-
dicular to the line of sight) or slanted in depth so that the horizontal dimension
was foreshortened to a degree that depended on the angle of slant, as illus-
trated in figure 8.12A. The beads in figure 8.12A were actually closer together
vertically, so when they were viewed in the frontal plane, as illustrated in fig-
ure8.12B,observersalwaysreportedthemasgroupedvertically intocolumns
rather than horizontally into rows.
The crucial question was what would happen when the same lattice of beads
was presented to the observer slanted in depth so that the beads were closer
together horizontally when measured in the retinal image, as depicted in figure
8.12C. (Notice that they are still closer together vertically when measured in the
3-D world.) Not surprisingly, when observers viewed this slanted display with
just one eye, so that no binocular depth information was available, they reported
the beads to be organized into rows as predicted by retinal proximity. This
presumably occurs because they mistakenly perceived the lattice as lying in the
frontal plane, even when it was slanted more than 40 in depth. When observ-
ers achieved veridical depth perception by viewing the same display binoc-
ularly, however, they reported seeing the slanted array of beads as organized
into vertical columns, just as they did in the frontal viewing condition. This
result supports the hypothesis that grouping occurs after stereoscopic depth
perception.
Rock, Nijhawan, Palmer, and Tudor (1992) addressed a similar issue in light-
ness perception: Is similarity grouping by achromatic color based on the reti-
nally measured luminance of elements or their phenomenally perceived lightness
after lightness constancy has been achieved? The first experiment used cast
shadows to decouple luminance and lightness. Observers were shown displays
similar to the one illustrated in figure 8.13 and were asked to indicate whether
the central column of elements grouped with the ones on the left or on the
right.
The structure of the display in the critical constancy condition is illustrated in
figure 8.13. It was carefully constructed so that the central squares were identi-