
Page 163 - T. Anderson-Fracture Mechanics - Fundamentals and Applns.-CRC (2005)
P. 163
1656_C003.fm Page 143 Monday, May 23, 2005 5:42 PM
Elastic-Plastic Fracture Mechanics 143
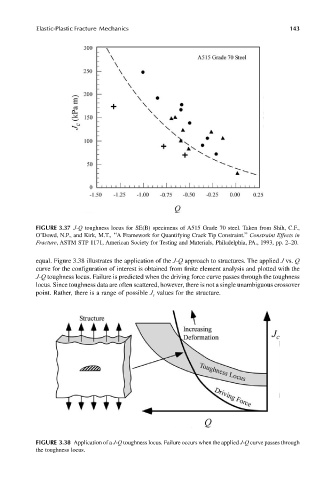
FIGURE 3.37 J-Q toughness locus for SE(B) specimens of A515 Grade 70 steel. Taken from Shih, C.F.,
O’Dowd, N.P., and Kirk, M.T., ‘‘A Framework for Quantifying Crack Tip Constraint.’’ Constraint Effects in
Fracture, ASTM STP 1171, American Society for Testing and Materials, Philadelphia, PA., 1993, pp. 2–20.
equal. Figure 3.38 illustrates the application of the J-Q approach to structures. The applied J vs. Q
curve for the configuration of interest is obtained from finite element analysis and plotted with the
J-Q toughness locus. Failure is predicted when the driving force curve passes through the toughness
locus. Since toughness data are often scattered, however, there is not a single unambiguous crossover
point. Rather, there is a range of possible J values for the structure.
c
FIGURE 3.38 Application of a J-Q toughness locus. Failure occurs when the applied J-Q curve passes through
the toughness locus.