
Page 161 - Fundamentals of Water Treatment Unit Processes : Physical, Chemical, and Biological
P. 161
116 Fundamentals of Water Treatment Unit Processes: Physical, Chemical, and Biological
R(BOD) (%) 42 39 48 22 39 34 48 22 25 28 30 29 45 33 57 41 23 68 33 31 37 51 50 Control and N.L.
BOD in (mg=L) 240 153 133 169 128 231 102 134 206 127 113 98 185 253 106 256 133 201 166 228 183 190 242 Pollution Nemerow,
Water
R(SS) (%) 61 44 67 39 55 61 48 16 30 31 48 39 63 40 69 66 40 76 54 50 69 67 54 and 1971; MA,
SS in (mg=L) 173 184 149 152 137 409 138 193 273 139 140 237 153 577 250 358 159 445 144 242 215 230 212 Engineers Reading,
Flow (gpd=ft) 56,800 408,000 106,500 284,000 215,000 94,500 100,000 118,000 24,000 35,500 97,000 44,430 46,000 214,000 27,200 24,000 25,000 23,700 14,500 20,400 17,300 120,000 12,500 Civil of Addison-Wesley,
Weir (m 3 =h=m) 29.39 211.11 55.10 146.95 111.24 48.90 51.74 61.06 12.42 18.37 50.19 22.99 23.80 110.73 14.07 12.42 12.94 12.26 7.50 10.56 8.95 62.09 6.47 Society American
(gpd=ft 2 ) 450 1650 760 2210 1670 1890 755 1470 1800 930 1300 855 1200 1430 362 1080 993 735 660 619 455 1010 187 8, No. Treatment,
v o Practice and
(m=h) 0.764 2.801 1.290 3.752 2.835 3.208 1.282 2.495 3.056 1.579 2.207 1.451 2.037 2.428 0.615 1.833 1.686 1.248 1.120 1.051 0.772 1.715 0.317 of Practices,
u (h) 3.53 1.41 2.48 0.98 1.25 1.25 2.49 1.22 1.32 2.16 1.70 2.02 1.49 1.33 1.86 2.00 2.64 2.45 2.71 2.91 5.12 1.87 7.18 Manual Theories, 1998. York,
L=D 11.4 20.8 13.3 10.3 10.7 7.7 12.7 6.7 9 13.5 14 5 10 11.7 8.3 15 6.5 8.7 21.2 8.5 13.1 11.4 16.7 WPCF New
36, Industry,
L=w 1.5 2.3 3.5 2.5 2.5 3.3 4.1 2.2 7.5 2.4 1.5 3.6 6.5 3.9 5.4 3.6 5.9 5.5 6.4 2.5 4.2 3.8 3.9 No. of Reinhold,
(ft) 9 13 10 12 12 13 10 10 13 12 12 10 10 11 9 12 14 10 10 10 13 10 8 Practice Wastes
D Nostrand
(m) 2.74 3.96 3.05 3.66 3.66 3.96 3.05 3.05 3.96 3.66 3.66 3.05 3.05 3.35 2.74 3.66 4.27 3.05 3.05 3.05 3.96 3.05 2.44 of Liquid
(ft) 68 117 40 52 50 33 32 31 16 67 109 14 15 32 14 50 16 16 33 33 40 32 32 Manual N.L., Van
w
(m) 20.7 35.7 12.2 15.8 15.2 10.1 9.8 9.4 4.9 20.4 33.2 4.3 4.6 9.8 4.3 15.2 4.9 4.9 10.1 10.1 12.2 9.8 9.8 ASCE Nemerow, Management,
(ft) 100 270 140 124 124 100 132 67 120 162 168 50 100 124 75 180 95 88 212 85 170 120 125 Design, 1959; Waste
L
(m) 30.5 82.3 42.7 37.8 37.8 30.5 40.2 20.4 36.6 49.4 51.2 15.2 30.5 37.8 22.9 54.9 29.0 26.8 64.6 25.9 51.8 36.6 38.1 Plant York, Hazardous
Data Tanks (#) 8 8 4 3 3 3 4 3 6 4 4 2 0.4 3 6 2 4 16 3 3 4 2 2 Treatment New Society, and
Tank Q (mgd) 24.3 418 17 41 31 18.7 12.77 9.17 20.7 41 95 1.24 7.36 17 2.3 19.4 6.1 16.45 13.94 5.19 12.3 7.76 1.5 Sewage the Industrial
Settling (m 3 =s) 1.06 18.31 0.74 1.80 1.36 0.82 0.56 0.40 0.91 1.80 4.16 0.05 0.32 0.74 0.10 0.85 0.27 0.72 0.61 0.23 0.54 0.34 0.07 ASCE-WPCF, of Headquarters of Strategies
Primary Day) Is.) Connecticut Oklahoma Connecticut from F.J.,
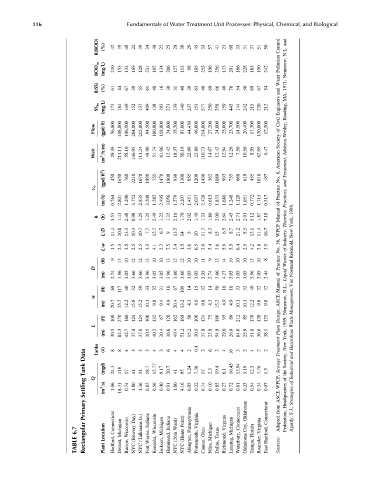
6.7 Rectangular Location Connecticut Michigan Wisconsin (Bowery (Talkmans Indiana Wayne, Wisconsin Michigan Indiana Ward) (26th Point) (Hunts Pennsylvania Virginia Ohio Michigan Texas Virginia Michigan City, Florida Virginia Hartford, Adapted Federation, Agardy,
TABLE Plant Hartford, Detroit, Racine, NYC NYC Fort Kenosha, Jackson, Hammond, NYC NYC Abington, Portsmouth, Canton, Niles, Dallas, Richmond, Lansing, Waterbury, Oklahoma Tampa, Roanoke, East Sources: