
Page 183 - Geochemical Remote Sensing of The Sub-Surface
P. 183
160 V. T. Jones, M.D. Matthews and D.M. Richers
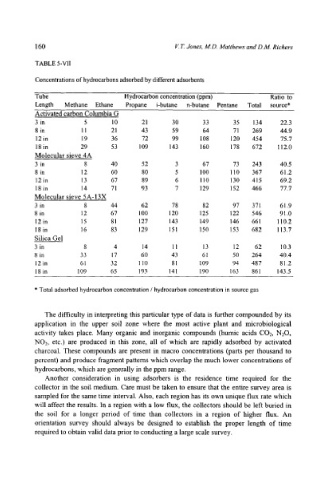
TABLE 5-VII
Concentrations of hydrocarbons adsorbed by different adsorbents
Tube Hydrocarbon concentration (ppm) Ratio to
Length Methane Ethane Propane i-butane n-butane Pentane Total source*
Activated carbon Columbia G
3 in 5 l 0 21 30 33 35 134 22.3
8 in 11 21 43 59 64 71 269 44.9
12 in 19 36 72 99 108 120 454 75.7
18 in 29 53 109 143 160 178 672 112.0
Molecular sieve 4A
3 in 8 40 52 3 67 73 243 40.5
8 in 12 60 80 5 100 110 367 61.2
12 in 13 67 89 6 110 130 415 69.2
18 in 14 71 93 7 129 152 466 77.7
Molecular sieve 5A-13X
3 in 8 44 62 78 82 97 371 61.9
8 in 12 67 100 120 125 122 546 91.0
12 in 15 81 127 143 149 146 661 110.2
18 in 16 83 129 151 150 153 682 113.7
Silica Gel
3 in 8 4 14 11 13 12 62 10.3
8 in 33 17 60 43 61 50 264 40.4
12 in 61 32 110 81 109 94 487 81.2
18 in 109 65 193 141 190 163 861 143.5
* Total adsorbed hydrocarbon concentration / hydrocarbon concentration in source gas
The difficulty in interpreting this particular type of data is further compounded by its
application in the upper soil zone where the most active plant and microbiological
activity takes place. Many organic and inorganic compounds (humic acids CO2, N20,
NO2, etc.) are produced in this zone, all of which are rapidly adsorbed by activated
charcoal. These compounds are present in macro concentrations (parts per thousand to
percent) and produce fragment patterns which overlap the much lower concentrations of
hydrocarbons, which are generally in the ppm range.
Another consideration in using adsorbers is the residence time required for the
collector in the soil medium. Care must be taken to ensure that the entire survey area is
sampled for the same time interval. Also, each region has its own unique flux rate which
will affect the results. In a region with a low flux, the collectors should be left buried in
the soil for a longer period of time than collectors in a region of higher flux. An
orientation survey should always be designed to establish the proper length of time
required to obtain valid data prior to conducting a large scale survey.