
Page 128 - High Temperature Solid Oxide Fuel Cells Fundamentals, Design and Applications
P. 128
Electrolytes 10 5
0.7 0.9 1.1 1.3
lOOO/T /K-l
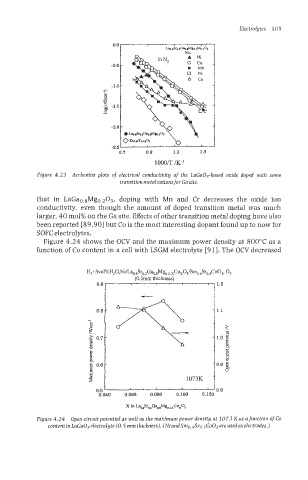
Figure 4.23 Arrhenius plots of electrical conductivity of the LaGa03-based oxide doped with some
transitionmetalcations for Gasite.
that in LaGao.sMgo.203, doping with Mn and Cr decreases the oxide ion
conductivity, even though the amount of doped transition metal was much
larger, 40 mol% on the Ga site. Effects of other transition metal doping have also
been reported [89,90] but Co is the most interesting dopant found up to now for
SOFC electrolytes.
Figure 4.24 shows the OCV and the maximum power density at 800°C as a
function of Co content in a ceII with LSGM electrolyte [91]. The OCV decreased
$ 3
a
e
- - 0.9 g
'5
Ofi
0
'3
3 1073K
0.6 0.8
0.040 0.060 0.080 0.100 0.120
x in w'ar~~~&cxcoxo,
Figure 4.24 Open circuit potential QS well as the maximum power density at 1073 K as a function of Co
are
content inL~Ga03 electrolyte (0.5 mm thickness). (~~iandSmo.sSr~.~Co03 usedaselectrodes.)