
Page 146 - How To Implement Lean Manufacturing
P. 146
124 Cha pte r Se v e n
Appendix C—The Balancing Study
Background
A balancing study is completed to see how well the actual work elements will fit into
the desired cycle time. It is easy enough to calculate the desired cycle time, but often
the work elements do not allow a perfect distribution of work. In addition, at the Zeta
cell the design was an outside U cell, with stationary operators so the operators could
not be moved as a technique to balance the work. Instead, the work needed to be
moved to the operators. Nonetheless, we came up with a nice balance for a first pass
(see Fig. 7-3 and Fig. 7-5).
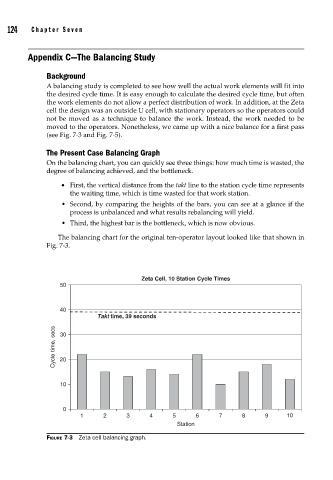
The Present Case Balancing Graph
On the balancing chart, you can quickly see three things: how much time is wasted, the
degree of balancing achieved, and the bottleneck.
• First, the vertical distance from the takt line to the station cycle time represents
the waiting time, which is time wasted for that work station.
• Second, by comparing the heights of the bars, you can see at a glance if the
process is unbalanced and what results rebalancing will yield.
• Third, the highest bar is the bottleneck, which is now obvious.
The balancing chart for the original ten-operator layout looked like that shown in
Fig. 7-3.
Zeta Cell, 10 Station Cycle Times
50
40
Takt time, 39 seconds
Cycle time, secs 30
20
10
0
1 2 3 4 5 6 7 8 9 10
Station
FIGURE 7-3 Zeta cell balancing graph.