
Page 151 - How To Implement Lean Manufacturing
P. 151
How to Do Lean—The Four Strategies to Becoming Lean 129
precludes the ability to take actions on these larger value stream maps. If actions are not
the result of the value stream map, then the map has lost most of its effectiveness.
The key benefit to value stream mapping is that it focuses on the entire value stream
to find system wastes and tries to avoid the pitfall of optimizing some local situation at
the expense of the overall optimization of the entire value stream. The strength of value
stream mapping may also be its weakness. It is not uncommon to find large wastes in
cells, for example, which are not detailed on VSMs. If this is the case, large wastes can
go unnoticed. This is a problem to those who only use VSMs in their battle to find and
eliminate waste. Value steam mapping is only one tool in the battle for waste reduction,
and to truly attack wastes, many tools are required.
VSMs detail information and the two key metrics highlighted are value added work
and production lead time.
Value Stream Mapping (VSM) Common Sense
First, VSM is a tool to assist you in the battle to reduce waste. Don’t get too hung up on
the rules. The general ideas will guide you nicely, but if there are some relevant data
you think would be helpful but you haven’t seen it on some primer on value stream
mapping, don’t hesitate to use it. The objective is waste reduction—don’t lose sight of
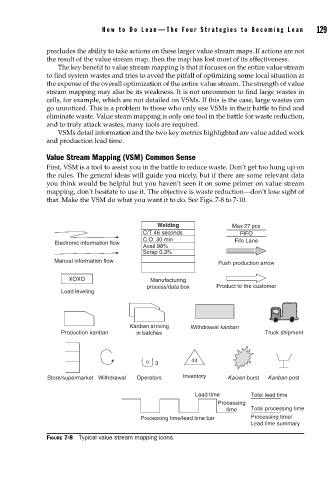
that. Make the VSM do what you want it to do. See Figs. 7-8 to 7-10.
Welding Max 27 pcs
C/T 46 seconds FIFO
C.O. 30 min Fifo Lane
Electronic information flow
Avail 98%
Scrap 0.3%
Manual information flow Push production arrow
XOXO Manufacturing
process/data box Product to the customer
Load leveling
Kanban arriving Withdrawal kanban
Production kanban in batches Truck shipment
44
3
Store/supermarket Withdrawal Operators Inventory Kaizen burst Kanban post
Lead time Total lead time
Processing
time Total processing time
Processing time/lead time bar Processing time/
Lead time summary
FIGURE 7-8 Typical value stream mapping icons.